Quantcast
Channel: Executive
Viewing all 238 articles
Browse latest View live

Data Center Cooling: CRAC/CRAH redundancy, capacity, and selection metrics

$
0
0

Striking the appropriate balance between cost and reliability is a business decision that requires metrics

By Dr. Hussein Shehata

This paper focuses on cooling limitations of down-flow computer room air conditioners/air handlers (CRACs/CRAHs) with dedicated heat extraction solutions in high-density data center cooling applications. The paper also explains how higher redundancy can increase total cost of ownership (TCO) while supporting only very light loads and proposes a metric to help balance the requirements of achieving higher capacities and efficient space utilization.

With several vendors proposing passive high-density technologies (e.g., cabinet hot air removal as a total resolution to the challenge of high density), this analysis shows that such solutions are only possible for a select few cabinets in each row and not for full deployments.

The vendors claim that the technologies can remove heat loads exceeding 20 kilowatts (kW) per cabinet, but our study disproves that claim; passive-cooling units cannot extract more heat than the cold air supplied by the CRACs. For the efficient design of a data center, the aim is to increase the number of cabinets and the total IT load, with the minimal necessary supporting cooling infrastructure. See Figure 1.

Figure 1. The relationship between IT and supporting spaces

Figure 1. The relationship between IT and supporting spaces

Passive Hot Air Removal
Data center design continually evolves towards increasing capacity and decreasing spatial volume, increasing energy density. High-end applications and equipment have higher energy density than standard equipment; however, the high-performance models of any technology have historically become the market standard with the passage of time, which in the case of the IT industry is a short period. As an example, every 3 years the world’s fastest supercomputers offer 10 times the performance of the previous generation, a trend that has been documented over the past 20 years.

Cooling high-density data centers is mostly commonly achieved by:

• Hot Air Removal (HAR) via cabinet exhaust ducts—active and passive.
See Figure 2.

Figure 2. HAR via cabinet exhaust ducts (active and passive). Courtesy APC

Figure 2. HAR via cabinet exhaust ducts (active and passive). Courtesy APC

• Dedicated fan-powered cooling units (i.e., chilled water cabinets).
See Figure 3.

Figure 3. Dedicated fan-powered cooling units

Figure 3. Dedicated fan-powered cooling units

This paper focuses on HAR/CRAC technology using an underfloor air distribution plenum.

Approach
High-density data centers require cooling units that are capable of delivering the highest cooling capacity using the smallest possible footprint. The high-powered CRACs in the smallest footprints available from the major manufacturer offer a net sensible cooling capacity of approximately 90 kW but require 3×1-meter (m) (width by depth) footprints. (Appendix C includes the technical specifications for the example CRAC).

Excluding a detailed heat load estimate and air efficiency distribution effectiveness, the variables of CRAC capacity, cabinet quantity, and cabinet capacity may be related in the following formula.

Note: The formula is simplified and focused on IT cooling requirements, excluding other loads such as lighting and solar gains.

CRAC Capacity = Number of IT cabinets x kW/cabinet (1)

Example 1 for N Capacity: If a 90-kW CRAC cools 90 cabinets, the
average cooling delivered per cabinet is 1 kW.

90 kW= 90 cabinets x 1 kW/cabinet (2)

Example 2 for N Capacity: If a 90-kW CRAC cools two cabinets, the
average cooling delivered per cabinet is 45 kW.

90 kW= 2 cabinets x 45 kW/cabinet (3)

The simplified methodology, however, does not provide practical insight into space usage and heat extraction capability. In Example 1, one CRAC would struggle to efficiently deliver air evenly to all 90 cabinets due to the practical constraints of CRAC airflow throw; in most circumstances the cabinets farthest from the CRAC would likely receive less air then the closer cabinets (assuming practical raised-floor heights and minimal obstructions to under floor airflow).

In Example 2, one CRAC would be capable of supplying sufficient cooling to both cabinets; however, the ratio of space utilization of the CRAC, service access space, and airflow throw buffer would result in a high space usage for the infrastructure compared to prime white space (IT cabinets). Other constraints, such as allocating sufficient perforated floor tiles/grills in case of a raised-floor plenum or additional Cold Aisle containment for maximum air distribution effectiveness may lead to extremely large Cold Aisles that again render the data center space utilization inefficient.

Figure 4. Typical Cold Aisle/Hot Aisle arrangement (ASHRAE TC9.9)

Figure 4. Typical Cold Aisle/Hot Aisle arrangement (ASHRAE TC9.9)

Appendix B includes a number of data center layouts generated to illustrate these concepts. The strategic layouts in this study considered maximum (18 m), average (14 m) and minimal (10 m) practical CRAC air throw, with CRACs installed perpendicular to cabinet rows on one and two sides as recommended in ASHRAE TC9.9. The front-to-back airflow cabinets are assumed to be configured to the best practice of Cold Aisle/Hot Aisle arrangement (See Figure 4). Variation in throw resulted in low, medium, and high cabinet count, best defined as high density, average density, and maximum packed (high number of cabinets) for the same data center whitespace area and electrical load (see Figure 5).

Figure 5. CRAC throw area

Figure 5. CRAC throw area

In the example layouts, CRACs were placed close together, with the minimal 500-millimeter (mm) maintenance space on one side and 1,000 mm on the long side (see Figure 6). Note that each CRAC manufacturer might have different unit clearance requirements. A minimal 2-m buffer between the nearest cabinet and each CRAC unit prevents entrainment of warm air into the cold air plenum. Cold and Hot aisle widths were modeled on approximately 1,000 mm (hot) and 1,200 mm (cold) as recommended in ASHRAE TC9.9 literature.

In the context of this study, CRAC footprint is defined as the area occupied by CRACs (including maintenance and airflow throw buffer); cabinet footprint is defined as the area occupied by cabinets (and their aisles). These two areas have been compared to analyze the use of prime footprint within the data center hall.

Tier level requires each and every power and cooling component and path to fulfill the Tier requirements; in the context of this paper the redundancy configuration reflects the Tier level of CRAC capacity components only, excluding considerations to other subsystems required for the facility’s operation. Tier I would not require redundant components, hence N CRAC units are employed. Tiers II, III, and IV would require redundant CRACs; therefore N+1 and N+2 configurations were also considered.

Figure 6. CRAC maintenance zone

Figure 6. CRAC maintenance zone

A basic analysis shows that using a CRAC as described above would require a 14-m2 area (including throw buffer), which would generate 25.7 kW of cooling for every 1 m of active CRAC perimeter at N redundancy, 19.3 kW for one-sided N+1 redundancy and two-sided N+2 redundancy, 22.5 kW for two-sided N+1 redundancy, and 12.9 kW for one-sided N+2 redundancy. However, data center halls are not predominantly selected and designed based on perimeter length, but rather on floor area.

The study focused on identifying the area required by CRAC units, compared to that occupied by IT cabinets, and defines it as a ratio. Figure 7 shows Tier I (N) one-sided CRACs in a high-density cabinet configuration. Appendix A includes the other configuration models.

Furthermore, a metric has been derived to help determine the appropriate cabinet footprint at the required Tier level (considering CRAC redundancy only).

Figure 7. Tier 1 (N) one-sided CRACs in a high-density cabinet configuration

Figure 7. Tier 1 (N) one-sided CRACs in a high-density cabinet configuration

Cabinet capacity to footprint factor C2F= kw/cabinet / C2C (4)

Where CRAC to Cabinet factor C2C= CRAC footprint / Cabinet footprint (5)

For multiple layout configurations, the higher the C2F, the more IT capacity can be incorporated into the space. Higher capacity could be established by more cabinets at lower densities or by fewer cabinets at higher densities. However, the C2F is closely linked to the necessary CRAC footprint, which as analyzed in this paper, could be a major limiting factor (see Figure 8).

Figure 8. C2F versus cabinet load (kW) for various CRAC redundancies

Figure 8. C2F versus cabinet load (kW) for various CRAC redundancies

Results
The detailed results appear in Appendix B. The variations analyzed included reference CRACs with no redundancy, with one redundant unit, and with two redundant units. For each of the CRAC configurations, three cabinet layouts were considered: maximum packed, average density, and high density).

Results showed that the highest C2F based on the six variations within each of the three redundancy configurations is as follows:

• Tier I (N)–one-sided CRAC deployment: C2F = 13

• Tier II-IV (N+1)–two-sided CRAC deployment: C2F = 11.4

• Tier II-IV (N+2 and above)–two-sided CRAC deployment: C2F = 9.8

The noteworthy finding is that the highest C2F in all 18-modeled variations was for high-density implementation and at a CRAC-to-cabinet (C2C) area ratio of 0.46 (i.e., CRACs occupy 32% of the entire space) and a cabinet footprint of 2.3 m2 per cabinet. This is supporting evidence that, although high-density cabinets would require more cooling footprint, high density is the most efficient space utilization per kW of IT.

Example 3 illustrates how the highest C2F on a given CRAC redundancy and one- or two-sided layout may be utilized for sizing the footprint and capacity within an average-sized 186-m2 data center hall for a Tier II-IV (N+2, C2F=9.8, C2C=0.5, and cabinet footprint of 2.3 m2) deployment. The space is divided into a net 124-m2 data hall for cabinets, and 62 m2 of space for CRAC units by utilizing the resulting ideal C2C of 0.46.

Example 3: If a net 124-m2 data hall for cabinets and 62 m2 of space for CRAC units is available, the highest achievable capacity would be 4.5 kW/cabinet.

9.8= 4.5 kW/cabinet/59 m2 : 127 m2 (6)

To determine the number of cabinets and CRACs, the CRAC cooling capability will be used rather than the common method of dividing the area by cabinet footprint.

The total area occupied by a CRAC is 14 m2; hence approximately four CRACs would occupy the 59-m2 space. Two CRACs are duty, since N+2 is utilized; therefore, the available capacity would be 90 kW x 2 = 180 kW. The number of cabinets that could then be installed in this 186-m2 total area would be 180/4.5 = 40 cabinets.

The total effective space used by the 40 cabinets is 92 m2 (40 x 2.3 m2 ) that is 72% of the available cabinet dedicated area. This shows that higher redundancy may be resilient but does not fully utilize the space efficiently. This argument highlights the importance of the debate between resilience and space utilization.

Example 4 illustrates how C2F may be utilized for sizing the footprint and capacity within the same data center hall but at a lower redundancy of N+1 configuration.

Example 4: By applying the same methodology, the highest achievable capacity would be 5.2 kW/cabinet.

11.4= (7)

The total area occupied by a CRAC is 14 m2 (including CRAC throw and maintenance); hence approximately four CRACs would occupy 59 m2 of space. Three CRACs would be on duty, since N+1 is utilized; therefore, the available capacity would be 90 kW x 3 = 270 kW. The number of cabinets that could then be installed in this 186-m2 total area would be 270/5.2 = 52 cabinets.

The total effective space used by the 52 cabinets is 120 m2 (52 x 2.3 m2 ), which is 95% of the space. The comparison of Example 3 to Example 4 shows that less redundancy provides more efficient space utilization.

image9

Figure 9. Summary of the results

The analysis shows that taking into consideration the maximum C2F results obtained for each redundancy type and then projecting output on a given average load per cabinet, an example average high-density cabinet of 20 kW would require the CRAC units to occupy double the IT cabinet space in an N+2 configuration, hence lowering the effective use of such prime IT floor space (See Figure 9).

Additional Metrics
Additional metrics for design purposes have been derived from the illustrated graphs and resultant formulae.

The derived formula could be documented as follows:

P=K/L+M-(6.4 x R/S)  (8)

Where
P = Cooling per perimeter meter (kW/m)
K = CRAC net sensible capacity (kW)
L = CRAC length (m)
M = CRAC manufacturer side maintenance clearance (m)
R = CRAC redundancy
S = One- or two-sided CRAC layout

Conclusion
Approximately 50% (270 kW/180 kW) more capacity, 30% more cabinets, and 16% higher-cabinet load density could be utilized in the same space with only one redundant CRAC and may still fulfill Tier II-IV component redundancy requirements. This is achievable at no additional investment cost as the same number of CRACs (4) is installed within the same available footprint of 2,000 ft2. The analysis also showed that the highest average practical load per cabinet should not exceed 6 kW if efficient space utilization is sought by maintaining a C2C of 0.46.

This study shows that an average high-density cabinet load may not be cooled efficiently with the use of only CRACs or even with CRACs coupled with passive heat-extraction solutions. The data supports the necessary implementation of row- and cabinet-based active cooling for high-density data center applications.

The first supercomputers used cooling water; however, the low-density data centers that were commissioned closer to a decade ago (below 2 kW per cabinet) almost totally eliminated liquid cooling. This was due to reservations about the risks of water leakage within live, critical data centers.

Data centers of today are considered to be medium-density facilities. Some of these data centers average below 4 kW per cabinet. Owners and operators that have higher demands and are ahead of the average market typically dedicate only a portion of the data center space to high-density cabinets.

With server density increasing every day and high-density cabinets (approaching 40 kW and above) becoming a potential future deployment, data centers seem likely to experience soaring heat loads that will demand comprehensive liquid-cooling infrastructures.

With future high-density requirements, CRAC units may become secondary cooling support or even more drastically, CRAC units may become obsolete!


Appendix A

Appendix A1. One-sided CRAC, maximum-throw, maximum-packed cabinets

Appendix A1. One-sided CRAC, maximum-throw, maximum-packed cabinets


Appendix A2. One-sided CRAC, average-throw, medium cabinets

Appendix A2. One-sided CRAC, average-throw, medium cabinets


Appendix A3. One-sided CRAC, minimum-throw, high-density cabinets

Appendix A3. One-sided CRAC, minimum-throw, high-density cabinets


Appendix A4. Two-sided CRAC, maximum-throw, maximum-packed cabinets.

Appendix A4. Two-sided CRAC, maximum-throw, maximum-packed cabinets.


Appendix A5. Two-sided CRAC, average-throw, medium packed cabinets

Appendix A5. Two-sided CRAC, average-throw, medium packed cabinets


Appendix A6. Two-sided CRAC, minimum-throw, high density cabinets

Appendix A6. Two-sided CRAC, minimum-throw, high density cabinets


Appendix B

JJ Hussein Appendix B1b image19


JJ HUssein Appendix B1a image20

Appendix B1. Tier I (N) CRAC modeling results

Note 1: HD = High Density
Note 2: MP = Max Packed
Note 3: * = CRAC Area includes maintenance and throw buffer
Note 4:^ = 27 m2 area is deducted from total area, as it is already included in the throw buffer

JJ Hussein Appendix B2b image21


Appendix B2. Tier II-IV (N+1) CRAC modeling results

Appendix B2. Tier II-IV (N+1) CRAC modeling results


Note 1: HD = High Density
Note 2: MP = Max Packed
Note 3: * = CRAC Area includes maintenance and throw buffer
Note 4: ^ = 27 m2 area is deducted from total area, as it is already included in the throw buffer

JJ Hussein Appendix B3b image23


Appendix B3. Tier II-IV (N+1) CRAC modeling results

Appendix B3. Tier II-IV (N+1) CRAC modeling results

Appendix C

image25


image26


JJ Hussein Appendix C4 image28

image27


Liebert CRAC Technical Specification
Note: Net sensible cooling will be reduced by 7.5 kW x 3 = 22.5 kW for fans; 68.7 kW for Model DH/VH380A


husseinDr Hussein Shehata, BA, PhD, CEng, PGDip, MASHRAE, MIET, MCIBSE, is the technical director, EMEA, Uptime Institute Professional Services (UIPS). Dr Shehata is a U.K. Chartered Engineer who joined Uptime Institute Professional Services in 2011. He is based in Dubai, serving the EMEA region. From 2008-2011, Hussein was vice president & AsiaPacific DC Engineering, Architecture & Strategy Head at JP Morgan in Japan. Prior to that, he co-founded, managed, and operated as a subject matter expert (SME) at PTS Consulting Japan. He graduated in Architecture, followed by a PhD in HVAC, and a diploma in Higher Education that focused on multi-discipline teaching, with a focus on Engineers and Architects.

The post Data Center Cooling: CRAC/CRAH redundancy, capacity, and selection metrics appeared first on Uptime Institute eJournal.


Annual Data Center Industry Survey 2014

$
0
0

The fourth annual Uptime Institute Data Center Industry Survey provides an overview of global industry trends by surveying 1,000 data center operators and IT practitioners. Uptime Institute collected responses via email February through April 2014 and presented preliminary results in May 2014 at the 9th Uptime Institute Symposium: Empowering the Data Center Professional.

To immediately access the full report, please provide your business contact information.

The post Annual Data Center Industry Survey 2014 appeared first on Uptime Institute eJournal.

Mark Thiele from Switch examines the options in today’s data center industry

$
0
0

In this series, three of the industry’s most well-recognized and innovative leaders describe the problems facing enterprise IT organizations today. In this part, Switch’s Mark Thiele suggests that service offerings often don’t fit customer’s long-term needs.

Customers in the data center market have a wide range of options. They can choose to do something internally, lease retail colocation space, get wholesale colocation, move to the cloud, or all of the above. What are some of the more prevalent issues with current market choices relative to data center selection?

Mark Thiele: Most of the data center industry tries to fit customers into status-quo solutions and strategies, doing so in many cases simply because, “Those are the products we have and that’s the way we’ve always done it.” Little consideration seems to be given to the longer-term business and risk impacts of continuing to go with the flow in today’s rapidly changing innovation economy.

The correct solution can be a tremendous catalyst, enabling all kinds of communication and commerce, and the wrong solution can be a great burden for 5-15 years.

In addition, many data center suppliers and builders think of the data center as a discrete and detached component. Its placement, location, and ownership strategy have little to do with IT and business strategies. The following six conclusions are drawn from conversations Switch is having on a daily basis with technology leaders from every industry.

Data centers should be purpose built buildings. A converted warehouse with sky light penetrations and a wooden roof deck isn’t a data center. It’s a warehouse to which someone has added extra power and HVAC. These remodeled wooden-roof warehouses present a real risk for the industry because thousands of customers have billions of dollars’ worth of critical IT gear sitting in these converted buildings where they are expecting their provider to be protecting them at elite mission critical levels. A data center is by its very nature part of your critical infrastructure; as such it should be designed from scratch to be a data center that can actually offer the highest levels of protection from dangers like fire and weather.

A container data center is not a foundational solution for most businesses but can be a good solution for specific niche opportunities (disaster support, military, extreme-scale homogeneous environments, etc.). Containers strand HVAC resources. If you need more HVAC in one container than another you cannot just share it. If a container loses HVAC, all the IT gear is at risk even though there may be millions of dollars of healthy HVAC elsewhere.

The data center isn’t a discrete component. Data centers are a critical part of your larger IT and enterprise strategies, yet many are still building and/or selling data centers as if they were just a real estate component.

One of the reasons that owning a data center is a poor fit for many businesses is that it is hard to make the tight link needed between a company’s data center strategy and its business strategy. It’s hard to link the two when one has a 1- to 3-year life (business strategy) and the other has a 15- to 25-year life (data center).

The modern data center is the center of the universe for business enablement and IT readiness. Without a strong ecosystem of co-located partners and suppliers, a business can’t hope to compete in the world of the agile enterprise. We hear from customers every day that they need access to a wide range of independently offered technology solutions and services that are on premises. Building your own data center and occupying it alone for the sake of control isolates your company on an island away from all of the partners and suppliers that might otherwise easily assist in delivering successful future projects. The possibilities and capabilities of locating in an ultra-scale multi-company technology ecosystem cannot be ignored in the innovation economy.

Data centers should be managed like manufacturing capacity. Like a traditional manufacturing plant, the modern data center is a large investment. How effectively and efficiently it’s operated can have a major impact on corporate costs and risks. More importantly, the most effective data center design, location, and ecosystem strategies can offer significant flexibility and independence for IT to expand or contract at various speeds and to go in different directions entirely as new ideas are born.

More enterprises are getting out of the data center business. Fewer than 5% of businesses and enterprises have the appropriate business drivers and staffing models that would cause them to own and operate their own facilities in the most efficient manner. Even among some of the largest and most technologically savvy businesses there is a significant change in views on how data center capacity should be acquired.


ThieleMark Thiele is EVP, Data Center Tech at SUPERNAP, where his responsibilities include evaluating new data center technologies, developing partners, and providing industry thought leadership. Mr. Thiele’s insights in to the next generation of technological innovations and how these technologies speak to client needs and solutions are invaluable. He shares his enthusiasm and passion for technology and how it impacts daily life and business on local, national, and world stages.

Mr. Thiele has a long history of IT leadership specifically in the areas of team development, infrastructure, and data centers.  Over a career of more than 20 years, he’s demonstrated that IT infrastructure can be improved to drive innovation, increase efficiency, and reduce cost and complexity.  He is an advisor to venture firms and start-ups, and is a globally recognized speaker at premier industry events.

The post Mark Thiele from Switch examines the options in today’s data center industry appeared first on Uptime Institute eJournal.

RagingWire’s Jason Weckworth Discusses the Execution of IT Strategy

$
0
0

In this series, Uptime Institute asked three of the industry’s most well recognized and innovative leaders to describe the problems facing enterprise IT organizations. Jason Weckworth examined the often-overlooked issue of server hugging; Mark Thiele suggested that service offerings often did not fit the customer’s long-term needs; and Fred Dickerman found customers and providers at fault.


Q: What are the most prevalent misconceptions hindering data center owners/operators trying to execute the organization’s IT strategy, and how do they resolve these problems?

Jason Weckworth: As a colocation provider, we sell infrastructure services to end users located throughout the country. The majority of our customers reside within a 200-mile radius. Most IT end users say that they need to be close to their servers. Yet remote customers, once deployed, tend to experience the same level of autonomy and feedback from their operations staffs as those who are close by. Why does this misconception exist?

We believe that the answer lies in legacy data center services vs. the technology of today’s data centers with the emergence of DCIM platforms.

The Misconception: “We need to be near our data center.”
The Reality: “We need real-time knowledge of our environment with details, accessibility, and transparent communication.”

As a pure colocation provider (IaaS), we are not in the business of managed services, hosting, or server applications. Our customers’ core business is IT services, and our core business is infrastructure. Yet they are so interconnected. We understand that our business is the backbone for our customers. They must have complete reliance and confidence in everything we touch. Any problem we have with infrastructure has the potential to take them off-line. This risk can have a crippling effect on an organization.

The answer to remote access is remote transparency.

Data Center Infrastructure Management (DCIM) solutions have been the darlings of the industry for two years running. The key offering, from our perspective, is real-time monitoring with detailed customization. When customers can see their individual racks, circuits, power utilization, temperature, and humidity, all with real-time alarming and visibility, they can pinpoint their risk at any given moment in time. In our industry, seconds and minutes count. Solutions always start with first knowing if there is a problem, and then, by knowing exactly the location and scope of that problem. Historically, customers wanted to be close to their servers so that they could quickly diagnose their physical environment without having to wait for someone to answer the phone or perform the diagnosis for them. Today, DCIM offers the best accessibility.

Remote Hands and Eyes (RHE) is a physical, hands-on service related to IT infrastructure server assets. Whether the need is a server reboot, asset verification, cable connectivity, or tape change, physical labor is always necessary in a data center environment. Labor costs are an important consideration of IT management. While many companies offer an outsourced billing rate that discourages the use of RHE as much as possible, we took an insurance policy approach by offering unlimited RHE for a flat monthly fee based on capacity. With 650,000 square feet (ft2) of data center space, we benefit greatly from scaling the environment. While some customers need a lot of services one month, others need hardly any at all. But when they need it, it’s always available. The overall savings of shared resources across all customers ends up benefitting everyone.

Customers want to be close to their servers because they want to know what’s really going on. And they want to know now. “Don’t sugarcoat issues, don’t spin the information so that the risk appears to be less than reality, and don’t delay information pending a report review and approval from management. If you can’t tell me everything that is happening in real time, you’re hiding something. And if you’re hiding something, then my servers are at risk. My whole company is at risk.” As the data center infrastructure industry has matured over the past 10 years, we have found that customers have become much more technical and sophisticated when it comes to electrical and mechanical infrastructure. Our solution to this issue of proximity has been to open our communication lines with immediate and global transparency. Technology today allows information to flow within minutes of an incident. But only culture dictates transparency and excellence in communication.

As a senior executive of massive infrastructure separated across the country on both coasts, I try to place myself in the minds of our customer. Their concerns are not unlike our own. IT professionals live and breathe uptime, risk management, and IT capacity/resource management. Historically, this meant the need to be close to the center of the infrastructure. But today, it means the need to be accessible to the information contained at the center. Server hugging may soon become legacy for all IT organizations.


Jason Weckworth

Jason Weckworth

Jason Weckworth is senior vice president and COO, RagingWire Data Centers. He has executive responsibility for critical facilities design and development, critical facilities operations, construction, quality assurance, client services, infrastructure service delivery, and physical security. Mr. Weckworth brings 25 years of data center operations and construction expertise to the data center industry. Previous to joining RagingWire, he was owner and CEO of Weckworth Construction Company, which focused on the design and construction of highly reliable data center infrastructure by self-performing all electrical work for operational best practices. Mr. Weckworth holds a bachelor’s degree in Business Administration from the California State University, Sacramento.


The post RagingWire’s Jason Weckworth Discusses the Execution of IT Strategy appeared first on Uptime Institute eJournal.

Empowering the Data Center Professional

$
0
0

Five questions to ask yourself, and five to ask your team
By Fred Dickerman

When Uptime Institute invited me to present at Symposium this year, I noticed that the event theme was Empowering the Data Center Professional. Furthermore, I noted that Uptime Institute described the Symposium as “providing attendees with the information to make better decisions for their organizations, and their careers.” The word empowering really caught my attention, and I decided to use the session to discuss empowerment with a peer group of data center professionals. The results were interesting.

If you manage people, chances are you have spent some time asking yourself about empowerment. You may not have used that word, but you would have certainly asked yourself how to make your people more productive, boost morale, develop your people, or address some other issue, which can be related back to empowering people.

If you don’t manage people but there is someone who manages you, you’ve probably thought about some of these issues in relationship to your job. You may have read books on the subject; there are a lot of books out there. You may have gone to the internet; I recently got 5,000,000 results from a Google search on the word empowerment. And many of us have attended at least one seminar on the subject of empowerment, leadership, motivation, or coaching. Empowerment Fire Walk is my favorite such title.

Even so, the act of empowering people is a hit-or-miss activity.

In 1985, the author and management consultant Edward deBono, perhaps best know for originating the concept of lateral thinking, wrote the book Six Thinking Hats (see the sidebar). In that book, DeBono presented an approach to discussion, problem solving, and group interactions, in which he describes six imaginary hats to represent the six possible ways of approaching a question.

The green hat, for instance, focuses on creativity, possibilities, alternatives, and new ideas. It’s an opportunity to express new concepts and new perceptions.

Let’s put our green hats firmly in place to examine the issue of empowerment. We can start by creating a distinction between two different types of questions. The first questions are the everyday questions, such as “Where should we go for lunch?, which UPS system provides the best value for investment?, and should we build our own data center or lease?” We value the answers to these questions. Everyday questions can be trivial or very important, with big consequences sometimes resting on the answers.

We derive value from answers to the other question type but also from the question itself. We can call these questions inquiries.

Focus is the difference between everyday questions and inquiries. The answer is the focus of the everyday question. Once we have an answer to an everyday question, we tend to forget the question altogether and base our next actions on the answer. After the question is forgotten, other possible answers are also forgotten.

On the other hand, if you are engaged in an inquiry, you continue to focus on the question—even after you have an answer. The inquiry leads to other answers and tests the answers you have developed. The inquiry continues to focus on the question. As Isaac Newton said, “I keep the subject of my inquiry constantly before me, and wait till the first dawning opens gradually, by little and little, into a full and clear light.”

In addition to having more than one answer (and usually no single right answer), other characteristics of the inquiry are:

• The answers rarely come easily or quickly

• The questions tend to be uncomfortable

• Answers to the initial question often lead to other questions
Thorstein Veblen said, “The outcome of any serious research can only be to make two questions grow where only one grew before.”

Our question, “How do you empower people,” pretty clearly falls into the category of inquiry.  Before we start to propose some of the answers to our empowerment inquiry, let’s introduce one more idea.

An Example
What is the difference between knowing how to ride a bicycle and being able to ride a bicycle? If you were like most children, you probably first decided to learn to ride a bicycle. Then you probably gathered some information, perhaps you read an article on how to ride a bicycle watched other people ride bicycles, or had a parent who helped.

After gathering information, you may have felt ready to ride a bicycle, but if you were speaking more precisely, you could really only claim to know how to ride a bicycle in theory. Then, you got on the bicycle for the first time and fell off. And, if your focus during that first attempt was on the instructions you obtained from your parents or other expert source, you were almost certain to fall off the first few times. Eventually, with patience and commitment, you finally learned how to ride the bicycle without falling off.

First, once you have ridden the bicycle, you will probably always be able to ride a bicycle. We use the phrase “like riding a bicycle” to describe any skill or ability which, once learned, seems to never be forgotten.

Second, if you were trying to teach someone else how to ride a bicycle, you probably could not find the words to convey what happens when you learn how to balance on the bicycle and ride it. In other words, even though you have successfully been able to ride the bicycle, it is very unlikely that you will be able to add anything useful to the instructions you obtained.

Third, making that shift from knowing how to being able to is likely to be unique to the basic skill of riding the bicycle. That is, learning to ride backward, on one wheel, or without holding the handlebars will require repeating the same process of trying and failing.

The hundreds or thousands of books, seminars, and experts providing knowledge on how to empower people cannot teach anyone the skill of empowering others. When you have empowered someone, you probably will not be able to put into words what you did to produce that result, at least not so that a person reading or hearing those words will gain the ability to empower others.

The ability to empower is probably not transferable. Empowering someone in different circumstances will require repeating the learning process.

You can probably see that this article is not going to teach you how to empower people. But if you are committed to empowering people and are willing to fall off the bicycle a few times, you will have new questions to ask.

Giving Power
The best way to empower someone is to give them power, which is easy if you are royalty. In medieval times, when monarchs had almost unlimited power, the empowerment was also very real and required only a prescribed ceremony to transfer power to the person.

Not surprisingly, the first step to empowering others still requires transferring official authority or power.

Managers today wrestle with how much authority and autonomy to give to others. In an article entitled “Management Time, Who’s Got the Monkey?” (Harvard Business Review, Nov.-Dec. 1974, reprint #99609), William Oncken and Donald Wass describe a new manager who realizes that the way he manages his employees does not empower them.

Every time one of the employees would bring a problem to the manager’s attention, the way the employee communicated the problem (in Oncken’s analogy a “monkey”) and the manager’s response to the problem would cause the problem to become the manager’s responsibility. Recognizing the pattern enabled the manager to change the way he interacted with his employees. He stopped taking ownership of the problems, instead supporting their efforts to resolve the problems by themselves. While Oncken and Wass focus mainly on time management for managers, the authors also deal with the eternal question for managers of delegation of authority, with five levels of delegation from subordinate waits to be told what to do (minimal delegation) to subordinate acts on his own initiative and reports at set intervals (maximum delegation)

They write, “Your employees can exercise five levels of initiative in handling on-the-job problems. From lowest to highest, the levels are:

•Wait until told what to do.

• Ask what to do.

• Recommend an action, and then with your approval, implement it.

• Take independent action, but advise you at once.

•Take independent action and update you through routine procedure.”

Symposium literature suggests another way to empower people: provide information. Everyone has heard the expression “Give a man a fish, he can eat for a day; teach a man to fish, he can eat for a lifetime.” To be more precise, we should say that if you teach a person to fish (the information transfer) and that person realizes the potential of this new ability, that person can eat for a lifetime.

The realization that fish are edible might be the person’s eureka moment. The distinction between teaching the mechanics of fishing and transferring the concept of fishing is subtle, but critical. The person who drops a hook in the water might catch fish occasionally, just as a person who gets on bicycle occasionally might cover some distance; however, the first person is not a fisherman and the second is not a bicyclist.

Besides delegating authority or providing information, there are other answers to our empowerment inquiry, such as providing the resources necessary to accomplish some objective or creating a safe environment to work, and let’s not forget constructive feedback and criticism.

An engineer who designs safety features into a Formula 1 car empowers the driver to go fast, without being overly concerned about safety. The driver is empowered by making the connection between the safety features and the opportunity to push the car faster.

A coach who analyzes a play so that the quarterback begins to see all of the elements of an unfolding play as a whole rather than as a set of separate actions and activities empowers the quarterback to see and seize opportunities while another quarterback is still thinking about what to do (and getting sacked).

These answers have some things in common:

Whether the actions or information is empowering is not inherent in those actions or the information. We know that because exactly the same actions, the same information, and the same methodologies can result in empowerment or no empowerment. If empowerment were inherent in some action or information, empowerment would result every time the action was taken.

Empowerment may be a result of the action or process, but it is not a step to be taken.

While it is almost certainly true that you cannot empower someone who does not want to be empowered, it is equally true that the willingness and desire to be empowered does not guarantee that empowerment will result from an interaction.

Now let’s talk about one more approach to empowerment. I had a mentor early in my career who liked to start coaching sessions by telling a joke. The setup for the joke was: “What does an American do when you ask him a question?” The punch line, “He answers it!”

Our teams reacted with dead silence. Our boss would assure us that the joke was considered very funny in Europe and that it was only our American culture that caused us to miss the punch line. Since he was the boss, we never argued. I’ve never tried the joke on my Russian friends, so I can’t confirm that they see the humor either.

The point, I think, was that Americans are culturally attuned to answers, not questions. Our game shows are about getting one right answer, first. Only Jeopardy, the television game show, pretends to care about the questions, but only as a gimmick.

When an employee experiences success and the boss asks about the approaches that worked when acknowledging that success, the boss is trying to empower that employee. The positive reinforcement and encouragement can cause the employee to go to look for the behaviors that contributed to that success and allow the employee to be successful in other areas. Empowerment comes when the employee takes a step back and finds an underlying behavior or way of looking at an issue or opportunity in the future.

Questions are especially empowering because they:

• Are non-threatening as opposed to direct statements

• Generate thought versus defense

• May lead to answers which neither the manager or the employee considered

•May lead to another question that empowers both you and your employee

• My presentation at the Symposium evolved as I prepared it. It was originally titled “Five Questions
Every Data Center Manager Should Ask Every Year.” As I have been working on using questions to
empower others (and myself) for a long time, the session was a great way for me to further that inquiry.

The five questions that I am currently living with are:

• Who am I preparing to take my job?

• How reliable does my data center need to be?

• What are the top 100 risks to my data center?

• What should my data center look like in 10 years?

• How do I know I am getting my job done?

And here are five questions that I have found to empower the people who work for me:

• What worked? In your recent success or accomplishment, what contributed to your success?

•What can I do as your boss to support your being more productive?

• What parts of your job are you ready to train others to do?

• What parts of my job would you like to take on?

• What training can we offer to make you more productive or prepare you to move up in our company?

These are examples of the kinds of inquiries that can be empowering, questions that you can ask yourself or someone else over and over again, possibly coming up with a different answer each time you ask. There may not be one right answer, and the inquiries maybe uncomfortable because they challenge what we already know.

G. Spencer Brown said, “To teach pride in knowledge is to put up an effective barrier against any advance upon what is already known, since it makes one ashamed to look beyond the bonds imposed by one’s ignorance.”

Whether your approach to empowering people goes through delegation, teaching, asking questions, or any of the other possible routes, keep in mind that the real aha moment comes from your commitment to the people who you want to empower. Johann Wolfgang Von Goethe said, “Until one is committed, there is hesitancy, the chance to draw back, always ineffectiveness. Concerning all acts of initiative and creation, there is one elementary truth the ignorance of which kills countless ideas and splendid plans: that the moment one definitely commits oneself, then providence moves too. All sorts of things occur to help one that would never otherwise have occurred. A whole stream of events issues from the decision, raising in one’s favor all manner of unforeseen incidents, meetings, and material assistance which no man could have dreamed would have come his way. Whatever you can do or dream you can, begin it. Boldness has genius, power, and magic in it. Begin it now.”


Six Thinking Hats

Six Thinking Hats

Six Thinking Hats, (From the web site of the de Bono Group, LLC.)

Well-known management consultant Edward de Bono wrote a book called Six Thinking Hats (Little, Brown and Company, 1985). His purpose was to empower people to resolve problems by giving them a mechanism to examine those problems in different ways—from different points of view. De Bono suggested that people imagine that they have six hats of different colors, with each hat representing a different approach or point of view to the problem.

The white hat calls for information known or needed. “The facts, just the facts.”

The yellow hat symbolizes brightness and optimism. Under this hat you explore the positives and probe for value and benefit.

The black hat is judgment, the devil’s advocate or why something may not work. Spot the difficulties and dangers; where things might go wrong. The black hat is probably the most powerful and useful of the hats but can be overused.

The red hat signifies feelings, hunches, and intuition. When using this hat you can express emotions and feelings and share fears, likes, dislikes, loves, and hates. The green hat focuses on creativity: the possibilities, alternatives, and new ideas. It’s an opportunity to express new concepts and new perceptions.

The blue hat is used to manage the thinking process. It’s the control mechanism that ensures the Six Thinking Hats guidelines are observed.


Fred Dickerman

Fred Dickerman

Fred Dickerman is vice president, Data Center Operations for DataSpace. In this role, Mr. Dickerman oversees all data center facility operations for DataSpace, a colocation data center owner/operator in Moscow, Russian Federation. He has more than 30 years experience in data center and mission-critical facility design, construction, and operation. His project resume includes owner representation and construction management for over US$1 billion in facilities development, including 500,000 square feet (ft2) of data center and 5 million ft2 of commercial properties. Prior to joining DataSpace, Mr. Dickerman was the VP of Engineering and Operations for a Colocation Data Center Development company in Silicon Valley.


The post Empowering the Data Center Professional appeared first on Uptime Institute eJournal.

Proper Data Center Staffing is Key to Reliable Operations

$
0
0

The care and feeding of a data center
By Richard F. Van Loo

Managing and operating a data center comprises a wide variety of activities, including the maintenance of all the equipment and systems in the data center, housekeeping, training, and capacity management for space power and cooling. These functions have one requirement in common: the need for trained personnel. As a result, an ineffective staffing model can impair overall availability.

The Tier Standard: Operational Sustainability outlines behaviors and risks that reduce the ability of a data center to meet its business objectives over the long term. According to the Standard, the three elements of Operational Sustainability are Management and Operations, Building Characteristics, and Site Location (see Figure 1).

Figure 1. According to Tier Standard: Operational Sustainability, the three elements of Operational Sustainability are Management and Operations, Building Characteristics, and Site Location.

Figure 1. According to Tier Standard: Operational Sustainability, the three elements of Operational Sustainability are Management and Operations, Building Characteristics, and Site Location.

Management and Operations comprises behaviors associated with:

• Staffing and organization

• Maintenance

• Training

• Planning, coordination, and management

• Operating conditions

Building Characteristics examines behaviors associated with:

• Pre-Operations

• Building features

• Infrastructure

Site Location addresses site risks due to:

• Natural disasters

• Human disasters

Management and Operations includes the behaviors that are most easily changed and have the greatest effect on the day-to-day operations of data centers. All the Management and Operations behaviors are important to the successful and reliable operation of a data center, but staffing provides the foundation for all the others.

Staffing
Data center staffing encompasses the three main groups that support the data center, Facility, IT, and Security Operations. Facility operations staff addresses management, building operations, and engineering and administrative support. Shift presence, maintenance, and vendor support are the areas that support the daily activities that can affect data center availability.

The Tier Standard: Operational Sustainability breaks Staffing into three categories:

• Staffing. The number of personnel needed to meet the workload requirements for specific maintenance
activities and shift presence.

• Qualifications. The licenses, experience, and technical training required to properly maintain and
operate the installed infrastructure.

• Organization. The reporting chain for escalating issues or concerns, with roles and responsibilities
defined for each group.

In order to be fully effective, an enterprise must have the proper number of qualified personnel, organized correctly. Uptime Institute Tier Certification of Operation Sustainability and Management & Operations Stamp of Approval assessments repeatedly show that many data centers are less than fully effective because their staffing plan does not address all three categories.

Headcount
The first step in developing a staffing plan is to determine the overall headcount. Figure 2 can assist in determining the number of personnel required.

Figure 2. Factors that go into calculating staffing requirements

Figure 2. Factors that go into calculating staffing requirements

The initial steps address how to determine the total number of hours required for maintenance activities and shift presence. Maintenance hours include activities such as:

• Preventive maintenance

• Corrective maintenance

• Vendor support

• Project support

• Tenant work orders

The number of hours for all these activities must be determined for the year and attributed to each trade.

For instance, the data center must determine what level of shift presence is required to support its business objective. As uptime objectives increase so do staffing presence requirements. Besides deciding whether personnel is needed on site 24 x 7 or some lesser level, the data center operator must also decide what level of technical expertise or trade is needed. This may result in two or three people on site for each shift. These decisions make it possible to determine the number of people and hours required to support shift presence for the year. Activities performed on shift include conducting rounds, monitoring the building management system (BMS), operating equipment, and responding to alarms. These jobs do not typically require all the hours allotted to a shift, so other maintenance activities can be assigned during that shift, which will reduce the overall total number of staffing hours required.

Once the total number hours required by trade for maintenance and shift presence has been determined, divide it by the number of productive hours (hours/person/year available to perform work) to get the required number of personnel for each trade. The resulting numbers will be fractional numbers that can be addressed by overtime (less than 10% overtime advised), contracting, or rounding up.

Qualification Levels
Data center personnel also need to be technically qualified to perform their assigned activities. As the Tier level or complexity of the data center increases, the qualification levels for the technicians also increase. They all need to have the required licenses for their trades and job description as well as the appropriate experience with data center operations. Lack of qualified personnel results in:

• Maintenance being performed incorrectly

• Poor quality of work

• Higher incidents of human error

• Inability to react and correct data center issues

Organized for Response
A properly organized data center staff understands the reporting chain of each organization, along with their individual roles and responsibilities. To aid that understanding, an organization chart showing the reporting chain and interfaces between Facilities, IT, and Security should be readily available and identify backups for key positions in case a primary contact is unavailable.

Impacts to Operations
The following examples from three actual operational data centers show how staffing inefficiencies may affect data center availability

The first data center had two to three personnel per shift covering the data center 24 x 7, which is one of the larger staff counts that Uptime Institute typically sees. Further investigation revealed that only two individuals on the entire data center staff were qualified to operate and maintain equipment. All other staff had primary functions in other non-critical support areas. As a result, personnel unfamiliar with the critical data center systems were performing activities for shift presence. Although maintenance functions were being done, if anything was discovered during rounds additional personnel had to be called in increasing the response time before the incident could be addressed.

The second data center had very qualified personnel; however, the overall head count was low. This resulted in overtime rates far exceeding the advised 10% limit. The personnel were showing signs of fatigue that could result in increased errors during maintenance activities and rounds.

The third data center relied solely on a call in method to respond to any incidents or abnormalities. Qualified technicians performed maintenance two or three days a week. No personnel were assigned to perform shift rounds. On-site Security staff monitored alarms, which required security staff to call in maintenance technicians to respond to alarms. The data center was relying on the redundancy of systems and components to cover the time it took for technicians to respond and return the data center to normal operations after an incident.

Assessment Findings
Although these examples show deficiencies in individual data centers, many data centers are less than optimally staffed. In order to be fully effective in a management and operations behavior, the organization must be Proactive, Practiced, and Informed. Data centers may have the right number of personnel (Proactive), but they may not be qualified to perform the required maintenance or shift presence functions (Practiced), or they may not have well-defined roles and responsibilities to identify which group is responsible for certain activities (Informed).

Figure 3 shows the percentage of data centers that were found to have ineffective behaviors in the areas of staffing, qualifications, and organization.

Figure 3. Ineffective behaviors in the areas of staffing, qualifications, and organization.

Figure 3. Ineffective behaviors in the areas of staffing, qualifications, and organization.

Staffing (appropriate number of personnel) is found to be inadequate in only 7% of data centers assessed. However, personnel qualifications are found to be inadequate in twice as many data centers, and the way the data center is organized is found to be ineffective even more often. Although these percentages are not very high, staffing affects all data center management. Staffing shortcomings are found to affect maintenance, planning, coordination, and load management activities.

The effects of staffing inadequacies show up most often in data center operations. According to the Uptime Institute Abnormal Incident Reports (AIRs) database, the root cause of 39% of data center incidents falls into the operational area (see Figure 4). The causes can be attributed to human error stemming from fatigue, lack of knowledge on a system, and not following proper procedure, etc. The right, qualified staff could potentially prevent many of these types of incidents.

Figure 4. According to the Uptime Institute Abnormal Incident Reports (AIRs) database, the root cause of 39% of data center incidents falls into the operational area.

Figure 4. According to the Uptime Institute Abnormal Incident Reports (AIRs) database, the root cause of 39% of data center incidents falls into the operational area.

Adopting the proven Start with the End in Mind methodology provides the opportunity to justify the operations staff early in the planning cycle by clearly defining service levels and the required staff to support the business.  Having those discussions with the business and correlating it to the cost of downtime should help management understand the returns on this investment.

Staffing 24 x 7
When developing an operations team to support a data center, the first and most crucial decision to make is to determine how often personnel need to be available on site. Shift presence duties can include a number of things, including facility rounds and inspections, alarm response, vendor and guest escorts, and procedure development. This decision must be made by weighing a variety of factors, including criticality of the facility to the business, complexity of the systems supporting the data center, and, of course, cost.

For business objectives that are critical enough to require Tier III or IV facilities, Uptime Institute recommends a minimum of one to two qualified operators on site 24 hours per day, 7 days per week, 365 days per year (24 x 7). Some facilities feel that having operators on site only during normal business hours is adequate, but they are running at a higher risk the rest of the time. Even with outstanding on-call and escalation procedures, emergencies may intensify quickly in the time it takes an operator to get to the site.

Increased automation within critical facilities causes some to believe it appropriate to operate as a “Lights Out” facility. However, there is an increased risk to the facility any time there is not a qualified operator on site to react to an emergency. While a highly automated building may be able to make a correction autonomously from a single fault, those single faults often cascade and require a human operator to step in and make a correction.

The value of having qualified personnel on site is reflected in Figure 5, which shows the percentage of data center saves (incident avoidance) based on the AIRs database.

Figure 5. The percentage of data center saves (incident avoidance) based on the AIRs database

Figure 5. The percentage of data center saves (incident avoidance) based on the AIRs database

Equipment redundancy is the largest single category of saves at 38%. However, saves from staff performing proper maintenance and having technicians on site that detected problems before becoming incidents totaled 42%.

Justifying Qualified Staff
The cost of having qualified staff operating and maintaining a data center is typically one of the largest, if not the largest, expense in a data center operating budget. Because of this, it is often a target for budget reduction. Communicating the risk to continuous operations may be the best way to fight off staffing cuts when budget cuts are proposed. Documenting the specific maintenance activities that will no longer be performed or the availability of personnel to monitor and respond to events can support the importance of maintaining staffing levels.

Cutting budget in this way will ultimately prove counterproductive, result in ineffective staffing, and waste initial efforts to design and plan for the operation of a highly available and reliable data center. Properly staffing, and maintaining the appropriate staffing, can reduce the number and severity of incidents. In addition, appropriate staffing helps the facility operate as designed, ensuring planned reliability and energy use levels.


Rich Van Loo

Rich Van Loo

Rich Van Loo is vice president, Operations for Uptime Institute. He performs Uptime Institute Professional Services audits and Operational Sustainability Certifications. He also serves as an instructor for the Accredited Tier Specialist course.

Mr. Van Loo’s work in critical facilities includes responsibilities ranging from projects manager of a major facility infrastructure service contract for a data center, space planning for the design/construct for several data center modifications, and facilities IT support. As a contractor for the Department of Defense, Mr. Van Loo provided planning, design, construction, operation, and maintenance of worldwide mission critical data center facilities. Mr. Van Loo’s 27-year career includes 11 years as a facility engineer and 15 years as a data center manager.


The post Proper Data Center Staffing is Key to Reliable Operations appeared first on Uptime Institute eJournal.

Data center design goals and certification of proven achievement are not the same

$
0
0

On March 13, 2015, Data Center Knowledge published an article “ViaWest Accused of Misleading Customers in Las Vegas”. The following is excerpted from the article.

ViaWest, the Shaw Communications-owned data center service provider, is being accused of misleading customers about reliability of its Las Vegas data center. Nevada Attorney General Adam Laxalt’s office has asked the company to address the accusations in a letter, a copy of which Data Center Knowledge has obtained. The letter is in response to a complaint filed with the attorney general by a man whose last name is Castor, but whose first name is not included. The accusation is that ViaWest has been advertising its Las Vegas data center as a Tier IV facility, when in fact it was not constructed to Tier IV standards. The attorney general’s letter says that in doing so the company may be in violation of the state’s Deceptive Trade Act.

Uptime Institute does not comment on specific projects, as a matter of commitment to our clients and governing policies.

But following the publication of the Data Center Knowledge article, we have received numerous variations on the following questions, which warrant clarification:

How many Tier Certifications of Design Documents, Constructed Facility, and Operational Sustainability has Uptime Institute awarded?

Since 2009, Uptime Institute has awarded 545 Certifications in 68 countries.

How many conflicts have been experienced in applying the Tier or Operational Sustainability criteria in any countries?

Uptime Institute criteria remain widely applicable and have not experienced conflict with local codes or jurisdictions.

How common is it for a data center to have one Tier Certification level for Design Documents and another Tier Certification level for Constructed Facility?

It is highly irregular for the Tier Certification of Design Documents (TCDD) and Tier Certification of Constructed Facility (TCCF) of the same data center to be misaligned in terms of Certification level. This is also an incongruent use of the Certification process, which was developed to provide assurances throughout the project to deliver on a single objective.

Instances of misaligned Tier Certification of Design Documents and installed infrastructure (i.e., stranded, altered or false Design Certifications) have been recklessly misleading to the industry and compelled us to amend the terms and conditions of Tier Certification so that Design Certifications expire after two years.

If discrepancies between Design and Facility Certifications happen, what is the purpose of the Tier Certification of Design Documents?

Tier Certification of Design Documents was never intended to be standalone designation as the end-point. It is provisional in nature and intended as a checkpoint on the Tier Certification of Constructed Facility and Operational Sustainability path to message upper management that the project is progressing to the Tier performance objective defined for the specific site.

There are multiple reasons that an enterprise data center project may achieve Tier Certification of Design Documents and not achieve Tier Certification of Constructed Facility. Some of these reasons include projects delays, cancellations, re-scoping. However, these same reasons for an enterprise project do not apply to a commercial data center services market, in which Tier Certifications drive competitive differentiation and pricing advantages for those who have demonstrated the capability of their facility.

What is Uptime Institute doing to prevent misrepresentation in the market?

In response to the gaming of the Tier Certification process for marketing reasons and to differentiate the achievement of Facility Certification, Uptime Institute implemented on 1 January 2014 a 2-year expiry for Tier Certification of Design Documents, as well as revocation rights for cases of clear, willful, and unscrupulous misrepresentations.

For a full list the sites that allow us to disclose their Tier Certification achievement please see: https://uptimeinstitute.com/TierCertification.

Julian Kudritzki, Chief Operating Officer, Uptime Institute

The post Data center design goals and certification of proven achievement are not the same appeared first on Uptime Institute eJournal.

Improve Project Success Through Mission Critical Commissioning

$
0
0

Rigorous testing of data center components should be a continuous process

By Ryan Orr, with Chris Brown and Ed Rafter

Many data center owners and others commonly believe that commissioning takes place only in the last few days before the facility enters into operation. In reality, data center commissioning is a continuous process that, when executed properly, helps ensure that the systems will meet mission critical objectives, design intent, and contract documents. The commissioning process should begin at project inception and continue through the life of the data center.

Uptime Institute’s extensive global field experience reveals that many of the problems, and subsequent consequences, observed in operational facilities could have been identified and remediated during a thorough commissioning process. Rigorous, comprehensive commissioning reduces initial failure rates, ensures that the data center functions as designed, and verifies facility operations capabilities—setting up Operations for success. At the outset of the commissioning program development, the owner and commissioning agent (CxA) should identify the important elements and benchmarks for each phase of the data center life cycle. Each element and benchmark must be executed successfully during commissioning to ensure the data center is rigorously examined prior to operations.

Uptime Institute wants to highlight the importance and benefits of commissioning for data center owners and operators and clarify the goals, objectives, and process of commissioning a data center.

This publication:

•   Defines and reinforces the basic concepts of the five levels of commissioning
•   Relates the levels of commissioning to the data center life cycle
•   Presents technical considerations for commissioning activities associated witheach phase
•   Details the overall management of a commissioning program
•   Identifies minimal roles and responsibilities for each stakeholder throughout the commissioning process

Commissioning tests some of the most important operations a data center will perform over its life and helps ease the transition between site development and daily operations. Commissioning:

•   Verifies that the equipment and systems operate as designed by the Engineer-of-Record
•   Provides a baseline for how the facility should perform throughout the rest of its life
•   Affords the best opportunity for Operations to become familiar with  how systems operate and test and verify operational procedures without risking critical IT loads
•   Determines the performance limits of a data center—the most overlooked benefit of commissioning

In other words, commissioning highlights what a system can do and how it will respond beyond the original requirements and design features if the process is executed to a high degree of quality. Commissioning, like data center operations, must be considered throughout the full life cycle of the data center (see Start with the End in Mind, The Uptime Institute Journal Vol. 3 p. 104). Commissioning should first be considered, and planned for, at a project’s inception and continue throughout the design, construction, transition-to-operations, and ongoing operations where re-commissioning is appropriate.Comissioning_Graphic_web

COMMISSIONING LEVELS
Over time, various organizations have defined the levels of commissioning. As a result, a data center owner may encounter a number of variations when attempting to understand and implement a commissioning program. With this publication, Uptime Institute clarifies the purpose of each level. However, each and every data center project is unique, which could mean that one or more of these activities might fit better within a different level of commissioning for some projects. Table 1 is organized to outline the process and sequence for commissioning, but the most important thing is that all the activities are completed. The high reliability essential to mission critical facilities requires that a rigorous and complete commissioning program includes all five levels to ensure that capital investments are not wasted.

Table 1. Commissioning Levels 1-5

Table 1. Commissioning Levels 1-5

COMMISSIONING AND UPTIME INSTITUTE TIERS
Unlike Uptime Institute’s Operational Sustainability Standard, the rigor associated with commissioning a data center has little relationship to its Tier level. The scope for commissioning and testing a Tier I data center may be less than that of a Tier IV data center—based on differences in the actual design complexity, topology, size, components, and sequence of operations. However, the roles and responsibilities and technical requirements for the commissioning team should not differ largely between Tiers and should be just as rigorous and comprehensive for a Tier I as it would be for a Tier IV.

COMMISSIONING STAKEHOLDERS
The most critical stakeholders involved on any project are listed below. They should fulfill their major roles sequentially. Stakeholders with additional expertise or valuable contributions should also participate. The CxA should ensure that the roles and responsibilities of the commissioning stakeholders are balanced and well documented.

Owner: The owner should initiate the commissioning process at the project outset, including identifying key stakeholders to take part in the program and communicating expectations for the commissioning program. Owner’s personnel are typically responsible for internal engineering, project management, and administration; however, the IT end user may also be part of the owner’s team. When the owner’s personnel lack the necessary experience for these activities, those responsibilities should be delegated to an authorized third-party representative, typically referred to as an owner’s representative. If the owner does not participate (or appoint a representative), no one on the commissioning team will have the knowledge or perspective to represent the owner’s interests. The end result could be a sub-standard facility, unnecessarily vulnerable to outages and unable to support the business needs.

Contractor: The commissioning team always includes the general contractor and specialty trade contractors, including mechanical, electrical, and controls, as well as OEM vendors who will be bringing equipment on site and assisting with testing. Without contractors, commissioning activities will be nearly impossible to complete properly. Contractors often coordinate vendors and physically operate equipment during commissioning procedures. Uptime Institute experience indicates that although contractors are rarely excluded entirely from commissioning their input is sometimes undervalued.

Architect and engineers: The Engineers-of-Record are legally responsible for the design of the data center, including those responsible for mechanical and electrical systems. Design intent may be compromised if designers do not participate in commissioning. The design engineer specifies the sequence of operations and is the only party who can confirm that the intent of the design was met.

Operations: The maintenance and operations managers, supervisors, and technicians are ultimately responsible for the day-to-day operations of the data center and its maintenance activities. This group may include owner’s personnelor a third party contracted for ongoing operations. Excluding Operations is a huge missed opportunity for training and compromises the team’s ability to verify maintenance and operations procedures (SOPs, EOPs, MOPs, etc.). Without live training during commissioning to verify effective procedures, the operations team will not be fully ready for maintenance or failures when the facility is in operation.

CxA: Ideally a third party is the responsible authority for the planning and execution of the entire commissioning process. The CxA may be an owner’s representative or a qualified mechanical or electrical contractor. Trying to commission without a CxA could result in poorly planned, undocumented, and unscripted commissioning activities. Additionally, it makes it more difficult to close out construction and properly transition to operations, which includes proper punch-list item closeout and execution of training for operations staff.

PRE-DESIGN PHASE ELEMENTS AND BENCHMARKS
Pre-design phase commissioning immediately follows the approval of a data center project and begins with selection of the CxA through a request for proposal (RFP) process (see Table 2). During the pre-design phase the owner, Engineers-of-Record, operations staff, and the CxA identify the owner’s project requirements (OPR) for the data center. Table 2 lists each participant in data center design, construction, and commissioning and denotes responsibility for particular tasks. In some projects, the owner may elect to utilize an owner’s representative to manage the day-to-day activities of the project on their behalf.

Table 2. Pre-Design Phase tasks

Table 2. Pre-Design Phase tasks

At this time, the owner should hire the data center facility manager and one data center facility supervisor to support the commissioning activities as representation for the operations team. It is not necessary to build the entire operations team to support the commissioning and construction activities.

PRE-DESIGN PHASE COMMISSIONING TECHNICAL REQUIREMENTS
Tasks to complete during the pre-design phase include developing a project schedule that includes commissioning, creating a budget, outlining a commissioning plan, and documenting the OPR and basis of design (BOD).

Technical requirements during this phase include:

CxA Selection

Selecting the CxA in the Pre-Design phase allows it to help develop the OPR and BOD, the commissioning program, the budget, and schedule.

The CxA should have and provide:

•   Appropriate staff to support the technical requirements of the project
•   Experience with mission critical/data center facility commissioning
•   Experience with the project’s known topologies and technologies
•   Sample commissioning documents (e.g., Commissioning Plan, Method  Statements, Commissioning Scripts, System Manual)
•   Commissioning certifications
•   Client referrals

The CxA should be:

•   Contracted directly to the owner to ensure the owner’s interests are held primary
•   Optimally aligned to both the owner’s operations team and the owner’s design and construction team to further align interests and gain efficiencies in coordinating activities throughout commissioning
•   An independent third party

Ideally, the CxA should not be an employee of the construction contractors or architect/engineering firms. When a third-party CxA is not a viable choice, the best alternative would be a representative from the owner’s team when the technical expertise is available within the company. When the owner’s team does not have the technical expertise required, a third-party mechanical or electrical contractor with commissioning experience could be utilized. Of course, cost is a factor in selecting a CxA, but it should not be allowed to compromise quality and rigor.

Project Schedule

•   Must include all commissioning activity time on the schedule to avoid project delays.
•   Should allot sufficient time for correcting installation and performance deficiencies revealed during commissioning.
•   Should assess the requirement and/or capability for post-occupancy commissioning activities. This can include provisions for seasonal commissioning to assess the performance of critical components in a variety of ambient conditions.

At this point, the schedule should have significant flexibility and can be better defined at each phase. Depending on the size, complexity, and sequence of operations associated with a facility, a rigorous Level 5 commissioning schedule could take up to 20 working days or longer. Even for small and relatively basic data centers, commissioning teams will find it challenging to complete Level 5 commissioning with a high level of detail and rigor in less than a few days.

Commissioning Budget

•   Should include a large contingency reserve for Level 4 and Level 5 commissioning budgets
•   Should include all items and personnel required to support complete commissioning

At this point in the process there are a considerable number of unknowns in the design, construction, and commissioning requirements. Budgets for Level 4 and Level 5 commissioning should include a large contingency reserve to accommodate the unknown parameters of the project. This contingency reserve can be reduced as appropriate as the project moves along and more and more items are defined. However, the final budget should still have a contingency reserve to account for unforeseeable issues, such as additional load bank rental time in the event commissioning takes longer than scheduled. Budgets need to include all items and personnel required to support commissioning. This includes, but is not limited to, load banks, calibrated measurement devices, data loggers, technician support, engineering support, and consumables such as fuel for engine-generator sets.

OPR and BOD

American Society of Heating, Refrigerating and Air-Conditioning Engineers, Inc. (ASHRAE) Standard 202 defines an OPR as “a written document that details the requirements of a project and the expectations of how it will be used and operated. This includes project goals, measurable performance criteria, cost considerations, benchmarks, success criteria, and supporting information. (The term Project Intent or Design Intent is used by some owners for their Commissioning Process Owner’s Project Requirements.)”

ASHRAE Standard 202 defines a BOD as “a document that records the concepts, calculations, decisions, and product selections used to meet the OPR and to satisfy applicable regulatory requirements, standards, and guidelines. This includes both narrative descriptions and lists of individual items that support the design process.”

The OPR and BOD are generated by the project owner and communicate important expectations for the data center project. These documents should be revised and updated at the end of each phase in the construction process. Specific to data center commissioning, the OPR and BOD should:

•   Comply with ASHRAE Standard 202, or similar
•   Specify that the CxA is responsible for all commissioning, testing, and formal reporting
•   Identify whether the intent of the data center design is to be scalable with IT requirements and whether the use of shared infrastructure is allowed and note any subsequent design features necessary to commissioning

The decision as to whether or not the design intent is to be scalable or use shared infrastructure will have a large effect on subsequent implementation and commissioning phases. Shared infrastructure systems in an incremental buildout can potentially increase the risk associated with future commissioning phases. Careful planning can mitigate this risk. Where shared infrastructure is to be used in a phased implementation, the OPR or BOD should highlight the importance of including design features that will allow a full and rigorous commissioning process at each phase of project implementation.

DESIGN AND PRE-CONSTRUCTION PHASE ELEMENTS AND BENCHMARKS

The design and pre-construction phases are commonly blended into a design/build format in which some activities are completed concurrently (see Table 3). The design typically goes through multiple iterations between the Engineer-of-Record and owner; each iteration identifies additional data center design details. Since the Engineer-of-Record is responsible for creating the designs and ensuring their concurrence with applicable commissioning documents, it becomes the responsibility of the other stakeholders to verify compliance. The CxA and contractor should review the design throughout this process, provide feedback based on their experience, and ensure compliance with the OPR document.

Table 3. Design and Pre-Construction Phase tasks

Table 3. Design and Pre-Construction Phase tasks

DESIGN AND PRE-CONSTRUCTION PHASE COMMISSIONING TECHNICAL REQUIREMENTS

Commissioning Plan

The commissioning plan is the heart of the commissioning program for a data center. While the CxA will take the lead in its development, all other stakeholders should review and participate in the approval of the final commissioning plan. Utilizing each unique skillset in developing and reviewing the commissioning program will help ensure a rigorous commissioning program.

Once appointed, the CxA must develop the overall commissioning plan, which generally includes:

•   Scope of commissioning activities, including identification of any re-commissioning requirements
•   General schedule of commissioning
•   Documentation requirements
•   Risk identification and mitigation plans
•   Required resources (e.g., tools, personnel, equipment)
•   Identification of the means and methods for testing

Design Review

•   For concurrence with the OPR and planned operations
•   For commissioning readiness

At this phase, appropriate stakeholders should develop plans, checklists, and reports for Level 1, Level 2, and Level 3. All stakeholders must review these documents. Additional technical requirements during this phase include:

•   Review project schedule and budget to ensure the schedule continues to maintain adequate resources  and time to complete commissioning
•   Verify adherence to OPR and BOD
• Amend documents as necessary in order to keep them up to date
• Add design elements as required to allow for the commissioning program to meet the minimum OPR and meet commissioning readiness requirements
•   If the design is scalable and to be implemented in future phases with shared systems, ensure that the design allows for future commissioning by including enhancements to reduce the risk to the active IT equipment.
•   Ensure that equipment specifications identify that the specified capacity is net of any deductions or tolerances allowed by national or international manufacturing standards (verified during Level 1 and Level 3)

Typically, long-lead items are procured using an RFP process in parallel with the design process. The commissioning requirements for this equipment should be included in the RFP documents and adherence to these should be assessed throughout the equipment delivery and installation. As part of these requirements, RFPs should identify the requirement for on-site OEM technician support throughout Level 4 and Level 5.

Commissioning Plans and Scripts for Level 1, Level 2, and Level 3

•   OEMs should provide the written test procedure to the commissioning team for approval prior to the Level 1 activities.
•   Contractors, in conjunction with the CxA, should provide Level 2 Post-Installation checklists from the record drawings to verify installation of all equipment.
•   The entire commissioning team should review all Level 2 checklists.
•   OEMs, in conjunction with the CxA, should provide start-up and functional checklists for Level 3.
•   Where component-level functional testing is necessary beyond the OEM’s typical scope of work, the
CxA shall create testing procedures that should be reviewed by the commissioning team and executed by
the contractors.

CONSTRUCTION PHASE ELEMENTS AND BENCHMARKS

Throughout the data center construction, the CxA will monitor progress to ensure that the installations conform to the OPR document. Additionally, the first three levels of commissioning will take place and be overseen by the CxA (see Table 4).

Table 4. Construction Phase tasks

Table 4. Construction Phase tasks

CONSTRUCTION PHASE COMMISSIONING TECHNICAL REQUIREMENTS

During the construction phase, the focus moves from developing plans to execution, with team members executing Level 1, Level 2, and Level 3 activities. At the same time, the operations team and the CxA develop scripts for Level 4 and Level 5, which are to be reviewed by all stakeholders.

Technical requirements during this phase include:

•   Review project schedule and budget to ensure the schedule continues to have adequate time and budget to
complete commissioning
•   Protect equipment stored on site awaiting installation from hazards (e.g., dirt and construction debris,
impact, fire hazards) and maintain according to manufacturer’s recommendations
•   Verify that circuit breakers are set in accordance with the short circuit and breaker coordination and arc
flash study
•   Repeat Level 1 procedures in the actual data center environment since factory witness testing is
performed in ideal conditions rarely seen in practice in the data center, ensuring that no equipment
damage occurred during transit and that the equipment performs at the same level as when it was tested
at the factory
•   Ensure that the building management system (BMS) functions at a basic level so that it is ready to
support critical Level 4 and Level 5 commissioning activities
•   Log critical asset information (e.g., make, model, serial number) into the maintenance management
system (MMS) (or other suitable recordkeeping) as equipment is received on site to be available for the
operations team
•   Continue to submit formal reports to the owner detailing all items tested, steps taken to test, and the
results as soon as reasonably possible
•   Repeat entire testing procedures when programming or control wiring is altered to correct a testing step
that does not complete successfully as it is possible to have an unexpected impact

In addition, Engineers-of-Record should provide a finalized sequence of operations document to the CxA, so it can create the Level 4 and Level 5 commissioning scripts.

Commissioning Plans and Scripts for Level 4 and Level 5

Script development is the responsibility of the CxA, with support from all other team members.
Plans and scripts should:

•   Identify every test and step to be taken to complete commissioning
•   Identify and describe the anticipated results for each step of the test
•   Identify responsible parties for each step of each test to ensure that everyone is available and
prepared, and to assist with schedule and budget reviews
•   Identify safety precautions and personal protection equipment (PPE) requirements for all team members

Testing should be conducted:

•   Under expected normal operations in the same manner that the operations team will operate the
data center
•   Under expected maintenance conditions in the same manner that the operations team will maintain
the data center
•   In manual operation as necessary to support future upgrades and replacements

In addition, commissioning should simulate system and component failures to test fault tolerant features, even when fault tolerance may not be a specific design assumption because it will inform the operations team on how the infrastructure responds when failures inevitably occur. Uptime Institute recommends testing in as many additional scenarios as possible that make sense for the design—even scenarios that may be outside the scope of design—to provide key information to operations about how to respond when the facility does not function and/or respond as designed.

LEVEL 4 AND 5 COMMISSIONING PHASE ELEMENTS AND BENCHMARKS

Once construction of the data center has been substantially completed, the CxA will lead the team through Levels 4 and 5 commissioning. The purpose of these activities is to ensure that individual systems and the full data center ecosystem function as they were intended in the design and OPR documents. This includes verifying requiredcapacities and ensuring that equipment can be isolated as intended and that the data center responds as expected to faults (see Table 5).

Table 5. Commissioning Phase tasks

Table 5. Commissioning Phase tasks

While weather cannot be anticipated, it can and will have an impact on the final commissioning results. Results from Level 4 and 5 commissioning activities should be extrapolated to predict how the equipment would perform at the actual design extreme temperatures and conditions. However, commissioning activities should be scheduled seasonally to verify system operation for the actual extreme and varying ambient conditions for which it was designed—especially in the event economizers are utilized in the data center.

LEVEL 4 and 5 COMMISSIONING PHASE TECHNICAL REQUIREMENTS

Level 4 and 5 commissioning presents a unique opportunity to any data center, which is to be able to fully test and practice equipment operation in any building condition without any risk to critical IT load. Improvements in future operations can result when stakeholders take advantage of this opportunity.

All critical components and systems must be fully tested—representative testing should not be acceptable for mission critical data centers.

Level 4

•   Level 4 must include load bank tests of the engine-generator sets, UPS, and UPS battery systems at design
and rated capacities.
•   Minimum continuous runtime durations of not less than eight hours are recommended for all load bank
tests; however, continuous runtimes of up to 24 hours are considered a best practice.
•   Ensure that load banks are distributed within critical areas to best simulate the actual IT environment
distribution, ideally physically located within racks and with forced cooling on a horizontal path, which
allows for more accurate and realistic mechanical system testing.
•   Prior to commencing Level 5, building management and control system (BMCS) graphics should be
completed to support the commissioning activities and to help commission the BMCS because operations
staff will eventually rely on the BMCS including alarming and data trending features.

Level 5

•   Ensure that commissioning team members and contractors are positioned strategically throughout the
data center to monitor all systems throughout Level 5
•   Size load banks as small as reasonably possible for Level 5 activities to best simulate the
actual IT environment for more accurate and realistic mechanical system testing
•   Perform Level 5 tests with the fire detection and suppression systems active, rather than in bypass to
ensure there is no adverse impact to the critical infrastructure
•   Isolate equipment at the upstream circuit breaker when performing equipment isolations to simulate
maintenance activities rather than at the local disconnect physically located on the unit
•   Complete evaluations when changes are made throughout Level 5 to fix deficiencies and determine
which, if any, tests must be repeated/redone
•   Consider the need to retest more than once in order to ensure the successful test was not an anomaly
when an initial test is not successfully completed
•   Complete testing on both utility power and on engine-generator power (or other alternative to utility
power source)
•   When simulating faults, simulate multiple fault types across separate tests on each piece of equipment
•   Ensure that sensor failures are included in the testing scope when simulating faults on highly automated
data centers that rely heavily upon field sensors
•   Document, identify, and validate normal operating set points, alarms, and component settings
•   Monitor alarms that are generated in the BMCS and electrical power monitoring system (EPMS) to
ensure that they are accurate and useful
•   At a minimum, take electrical load and critical area temperature readings between each discrete test;
where data loggers are used, measurements should be logged every 30-60 seconds
•   Test a variety of load conditions—25%, 50%, 75%, and 100% step loads—in order to simulate the actual
load conditions as a data center gradually increases its critical IT load
•   Test (as possible without causing damage) emergency conditions—such as N-1 and no cooling with
design load—to provide the information necessary for the operations team to structure future
emergency operating practices and plan for staff appropriately
•   Install aisle containment strategies that are to be utilized as part of the design to ensure the aisle
containment strategies support the infrastructure as required

Site Cleanup

•   Replace the air filters for the electrical systems and heating, ventilation, and air conditioning (HVAC)
systems following the conclusion of Level 5 commissioning
•   Flush and clean piping and ductwork to ensure construction debris does not impact future mechanical
plant performance

TURNOVER-TO-OPERATIONS PHASE ELEMENTS AND BENCHMARKS

The turnover-to-operations includes all activities associated with formally turning the facility over to the owner and Operations. Primarily, this includes completing the final documentation associated from the commissioning activities Levels 1-5 and utilizing the commissioning results to finalize SOPs, MOPs, and EOPs.

Needless to say, this is a critical juncture for the data center. Soon after Level 4 and 5, the facility will become live and support critical IT infrastructure, which begins the need to maintain the facility. At this time, Operations must take all of the lessons learned and knowledge gained from the construction and commissioning phases to finalize the maintenance and operations program. Operations must complete this work in a relatively short amount of time in order to minimize risk to the data center. The longer it takes to finalize all of the documentation and processes, the longer the facility will be at risk. Operations needs full support during this transition to ensure the overall uptime and success of the data center.

During the Turnover-to-Operations phase, the CxA duties can include:

•   Ensuring that all post-Level 5 punchlist items are successfully completed and closed out
•   Facilitating and/or coordinating infrastructure or OEM training to the operations staff
•   Assisting as necessary the development of critical operating procedures.

The CxA is also responsible for gathering all testing reports and checklists from all five levels of commissioning to create the final commissioning report. The final report to the owner should include:

•   Electrical and mechanical load and system condition readings taken at timely intervals before major
actions are implemented in each test
•   All steps, results, and system readings at every stage of the commissioning

The CxA should return to the site approximately one year following completion of commissioning to review the building operations and to ensure there are no outstanding items related to re-commissioning or seasonal commissioning efforts.

RE-COMMISSIONING AND FUTURE INSTALLATION PHASE ELEMENTS AND BENCHMARKS

Commissioning should be performed any time new infrastructure is installed or any time there is a significant change to the configuration of existing infrastructure. This could include planned expansion of the data center or major replacements (see Table 6).

Table 6. Re-Commissioning Phase tasks

Table 6. Re-Commissioning Phase tasks

In data centers that are built to be scalable, it is imperative that commissioning be just as rigorous for the follow-on infrastructure deployments to minimize risk to the facility. Commissioning activities undoubtedly add risk to the data center, especially where infrastructure systems are shared. However, this risk must be weighed against the risk of performing the associated commissioning tests. If a component or system is not going to perform as expected, the owner must decide if it is better to have this occur during a planned commissioning activity or during an unplanned failure. While performing a rigorous commissioning program during the initial buildout may prove the concept of the design, the facility could potentially be at risk if all of the new infrastructure components and systems are not tested rigorously.

These types of commissioning activities, by their very nature, occur while the systems are supporting critical IT load. In these instances, the operations team best knows how these activities may impact that mission critical load. During re-commissioning or incremental commissioning, the operations team should be working in very close collaboration with the commissioning team to ensure the integrity of the data center. Additionally, if re-commissioning involves changes to the configuration of the data center, Operations needs full awareness so that operating procedures that impact maintenance and emergency activities can be updated and tested completely.

The best way to mitigate the risk of re-commissioning efforts or for follow-on phases is to ensure that the facility is properly and extensively commissioned when it is originally built. And, as part of a rigorous re-commissioning program, all of the points discussed in this paper for standard commissioning apply to the re-commissioning efforts. However, due to the higher level of risk with these activities, there are some additional requirements.

RE-COMMISSIONING AND FUTURE INSTALLATION PHASE TECHNICAL REQUIREMENTS

All of the technical requirements previously provided apply to re-commissioning and future installation phases. However, follow-up commissioning activities also require the following special considerations by the CxA:

•   Adequate notice must be provided to service owners about the schedule, duration, risk, and
countermeasures in place for the re-commissioning activities in order to gain concurrence from IT
end users.
•   For facilities that are based on a dual-corded IT equipment topology, the owner and Operations
should verify that the existing critical load is appropriately dual corded where systems that support
installed IT loads are to be commissioned.
•   As load banks can introduce contaminates, load bank placement should be considered carefully so as not
to impact the existing critical IT equipment.
•   Detailed commissioning scripts must be prepared and followed during commissioning to ensure minimal
risk to existing IT equipment. Priority should be given to the live production IT environment, and back-out
procedures should be in place to ensure an optimal mean time to recovery (MTTR) in case of a power
down event.
•   Seasonal testing of the systems should be performed to verify performance in a variety of climatic
conditions, including extreme ambient conditions. This also ensures that economizers, where used, will
be tested properly.

CONCLUSION

Commissioning activities represent a unique opportunity for data center owners. The ability to rigorously test the capabilities of the critical infrastructure that support the data center without any risk to mission critical IT loads is an opportunity that should be capitalized on to the maximum possible extent. Uptime Institute observes that this critical opportunity is being wasted far too often in data center facilities, with not nearly enough emphasis on the rigor and depth of the commissioning program required for a mission critical facility until critical IT hardware is already connected.

A well-planned and executed commissioning program will help validate the capital investment in the facility to date. It will also put the operations team in a far better position to manage and operate the critical infrastructure for the rest of the data center’s useful life, and ultimately ensure that the facility realizes its full potential.


Ryan Orr

Ryan Orr

Ryan Orr joined Uptime Institute in 2012 and currently serves as a senior consultant. He performs Design and Constructed Facility Certifications, Operational Sustainability Certifications, and customized Design and Operations Consulting and Workshops. Mr. Orr’s work in critical facilities includes responsibilities ranging from project engineer on major upgrades for legacy enterprise data centers, space planning for the design and construction of multiple new data center builds, and data center Maintenance and Operations support.


Chris Brown

Chris Brown

Christopher Brown joined Uptime Institute in 2010 and currently serves as Vice President, Global Standards and is the Global Tier Authority. He manages the technical standards for which Uptime Institute delivers services and ensures the technical delivery staff is properly trained and prepared to deliver the services. Mr. Brown continues to actively participate in the technical services delivery including Tier Certifications, site infrastructure audits, and custom strategic-level consulting engagements.


Ed Rafter

Ed Rafter

Edward P. Rafter has been a consultant to Uptime Institute Professional Services (ComputerSite Engineering) since 1999 and assumed a full-time position with Uptime Institute in 2013 as principal of Education and Training. He currently serves as vice president-Technology. Mr. Rafter is responsible for the daily management and direction of the professional education staff to deliver all Uptime Institute training services. This includes managing the activities of the faculty/staff delivering the Accredited Tier Designer (ATD) and Accredited Tier Specialist (ATS) programs, and any other courses to be developed and delivered by Uptime Institute.


The post Improve Project Success Through Mission Critical Commissioning appeared first on Uptime Institute eJournal.


Avoiding Data Center Construction Problems

$
0
0

Experience, teamwork, and third-party verification are keys to avoiding data center construction problems
By Keith Klesner

In 2014, Uptime Institute spoke to the common conflicts between data center owners and designers. In our paper, “Resolving Conflicts Between Data Center Owners and Designers” [The Uptime Institute Journal, Volume 3, p 111], we noted that both the owner and designer bear a certain degree of fault for data center projects that fail to meet the needs of the enterprise or require expensive and time-consuming remediation when problems are uncovered during commissioning or Tier Certification.

Further analysis reveals that not all the communications failures can be attributed to owners or designers. In a number of cases, data center failures, delays, or cost overruns occur during the construction phase because of misaligned construction incentives or poor contractor performance. In reality, the seeds of both these issues are sown in the earliest phases of the capital project, when design objectives, budgets, and schedules are developed, RFPs and RFIs issued, and the construction team assembled. The global scale of planning shortfalls and project communication issues became clear due to insight gained through the rapid expansion of the Tier Certification program.

Many construction problems related to data center functionality are avoidable. This article will provide real-life examples and ways to avoid these problems.

In Uptime Institute’s experience from more than 550 Tier Certifications in over 65 countries, problems in construction resulting in poor data center performance can be attributed to:

•   Poor integration of complex systems

•   Lack of thorough commissioning or compressed commissioning schedules

•   Design changes

•   Substitution of materials or products

These issues arise during construction, commissioning, or even after operations have commenced and may impact cost, schedule, or IT operations. These construction problems often occur because of poor change management processes, inexperienced project teams, misaligned objectives of project participants, or lack of third-party verification.

Lapses in construction oversight, planning, and budget can mean that a new facility will fail to meet the owner’s expectations for resilience or require additional time or budget to cure problems that become obvious during commissioning—or even afterwards.

APPOINTING AN OWNER’S REPRESENTATIVE

At the project outset, all parties should recognize that owner objectives differ greatly from builder objectives. The owner wants a data center that best meets cost, schedule, and overall business needs, including data center availability. The builder wants to meet project budget and schedule requirements while preserving project margin. Data center uptime (availability) and operations considerations are usually outside the builder’s scope and expertise.

Thus, it is imperative that the project owner—or owner’s representatives—devise contract language, processes, and controls that limit the contractors’ ability to change or undermine design decisions while making use of the contractors’ experience in materials and labor costs, equipment availability, and local codes and practices, which can save money and help construction follow the planned timeline without compromising availability and reliability.

Data center owners should appoint an experienced owner’s representative to properly vet contractors. This representative should review contractor qualifications, experience, staffing, leadership, and communications. Less experienced and cheaper contractors can often lead to quality control problems and design compromises.

The owner or owner’s representative must work through all the project requirements and establish an agreed upon sequence of operations and an appropriate and incentivized construction schedule that includes sufficient time for rigorous and complete commissioning. In addition, the owner’s representative should regularly review the project schedule and apprise team members of the project status to ensure that the time allotted for testing and commissioning is not reduced.

Project managers, or contractors, looking to keep on schedule may perform tasks out of sequence. Tasks performed out of sequence often have to be reworked to allow access to space allocated to another system or to correct misplaced electrical service, conduits, ducts, etc., which only exacerbates scheduling problems.

Construction delays should not be allowed to compromise commissioning. Incorporating penalties for delays into the construction contract is one solution that should be considered.

VALUE ENGINEERING

Value Engineering (VE) is a regularly accepted construction practice employed by owners to reduce the expected cost of building a completed design. The VE process has its benefits, but it tends to focus just on the first costs of the build. Often conducted by a building contractor, the practice has a poor reputation among designers because it often leads to changes that compromise the design intent. Yet other designers believe that in qualified hands, VE, even in data centers, can yield savings for the project owner, without affecting reliability, availability, or operations.

If VE is performed without input from Operations and appropriate design review, any initial savings realized from VE changes may be far less than charges for remedial work needed to restore features necessary to achieve Concurrent Maintainability or Fault Tolerance and increased operating costs over the life of the data center (See Start with the End in Mind, The Uptime Institute Journal, Volume 3, p.104).

Uptime Institute believes that data center owners should be wary of changes suggested by VE that deviate from either the owner’s project requirements (OPR) or design intent. Cost savings may be elusive if changes resulting from VE substantially alter the design. As a result, each and every change must be scrutinized for its effect on the design. Retaining the original design engineer or a project engineer with experience in data centers may reduce the number of inappropriate changes generated during the process. Even so, data center owners should be aware that Uptime Institute personnel have observed that improperly conducted VE has led to equipment substitutions or systems consolidations that compromised owner expectations of Fault Tolerance or Concurrent Maintainability. Contractors may substitute lower-priced equipment that has different capacity, control methodology, tolerances, or specifications without realizing the effect on reliability.

Examples of VE changes include:

•   Eliminating valves needed for Concurrent Maintainability (see Figure 1)

•   Reducing the number of  automatic transfer switches (ATS) by consolidating equipment onto a single ATS

•   Deploying one distinct panel rather than two, confounding Fault Tolerance

•   Integrating economizer and energy-efficiency systems in a way that does not allow for Concurrent Maintainability or Fault Tolerant operation

image4


Figure 1. Above, an example of a design that meets Tier III Certification requirements. Below, an example of a built system that underwent value engineering. Note that there is only one valve between components instead of the two shown in the design.

Figure 1. Above, an example of a design that meets Tier III Certification requirements. Below, an example of a built system that underwent value engineering. Note that there is only one valve between components instead of the two shown in the design.

ADEQUATE TIME FOR COMMISSIONING

Problems attributed to construction delays sometimes result when the initial construction timeline does not include adequate time for Level 4 and Level 5 testing. Construction teams that are insufficiently experienced in the rigors of data center commissioning (Cx) are most susceptible to this mistake. This is not to say that builders do not contribute to the problem by working to a deadline and regarding the commissioning period as a kind of buffer that can be accessed when work runs late. For both these reasons, it is important that the owner or owner’s representative take care to schedule adequate time for commissioning and ensure that contractors meet or exceed construction deadlines. A recommendation would be to engage the Commissioning Agent (CxA) and General Contractor early in the process as a partner in the development of the project schedule.

In addition, data center capital projects include requirements that might be unfamiliar to teams lacking experience in mission critical environments; these requirements often have budgetary impacts.

For example, owners and owner’s representatives must scrutinize construction bids to ensure that they include funding and time for:

•   Factory witness tests of critical equipment

•   Extended Level 4 and Level 5 commissioning with  vendor support

•   Load banks to simulate full IT load within the  critical environment

•   Diesel fuel to test and verify engine-generator systems

EXAMPLES OF DATA CENTER CONSTRUCTION MISTAKES

Serious mistakes can take place at almost any time during the construction process, including during the bidding process. In one such instance, an owner’s procurement department tried to maximize a vendor discount for a UPS but failed to order bus and other components to connect the UPS.

In another example, consider the contractor who won a bid based on the cost of transporting completely assembled generators on skids for more than 800 miles. When the vendor threatened to void warranty support for this creative use of product, the contractor was forced to absorb the substantial costs of transporting equipment in a more conventional way. In such instances, owners might be wise to watch closely whether the contractor tries to recoup his costs by changing the design or making other equipment substitution.

During the Tier Certification of a Constructed Facility  (TCCF) for a large financial firm, Uptime Institute uncovered a problematic installation of electrical bus duct. Experienced designers and contractors, or those willing to involve Operations in the construction process, know that these bus ducts should be regularly scanned under load at all joints. Doing so ensures that the connections do not loosen and  overheat, which can lead to an arc-based failure. Locating the bus over production equipment or in hard to reach locations may prevent thorough infrared scanning and eventual maintenance.

Labeling the critical feeders is just as important so Operations knows how to respond to an incident and which systems to shut down (see Figure 2).

Figure 2. A contractor that understands data centers and a construction management team that focuses on a high reliability data center can help owners achieve their desired goals. In this case, design specifications and build team closely followed the intent of a major data center developer for a clear labeling system of equipment with amber (primary) side and blue (alternate) equipment and all individual feeders. The TCCF process found no issues with Concurrent Maintainability of power systems.

Figure 2. A contractor that understands data centers and a construction management team that focuses on a high reliability data center can help owners achieve their desired goals. In this case, design specifications and build team closely followed the intent of a major data center developer for a clear labeling system of equipment with amber (primary) side and blue (alternate) equipment and all individual feeders. The TCCF process found no issues with Concurrent Maintainability of power systems.

In this case, the TCCF team found that the builder implemented a design as it saw fit, without considering maintenance access or labeling of this critical infrastructure. The builder had instead rerouted the bus ducts into a shared compartment and neglected to label any of the conductors.

In another such case, a contractor in Latin America simply did not want to meet the terms of the contract. After bidding on a scope of work, the contractor made an unapproved change that was approved by the local engineer. Only later did the experienced project engineer hired by the owner note the discrepancy, which began a months-long struggle to get the contractor to perform. During this time, when he was reminded of his obligation, he simply deflected responsibility and eventually admitted that he didn’t want to do the work as specified. The project engineer still does not know the source of the contractor’s intransigence but speculates that inexperience led him to submit an unrealistically low bid.

Uptime Institute has witnessed all the following cooling system problems in facilities with Tier III objectives:

•   When the rooftop unit (RTU) control sequence was not well understood and coordinated, RTU supply air  fan and outside air dampers did not  react at the same speed, creating over/under pressure conditions in the data hall. In one case, over-pressurization blew a wall out. In another case over/under pressure created door opening and closing hazards.

•   A fire detection and suppression system was specifically reviewed for Concurrent Maintainability to ensure no impact to power or cooling during any maintenance or repair activities. At the TCCF, Uptime Institute recognized that a dual-fed UPS power supply to a CRAC shutdown relay that fed a standing voltage system was still an active power supply to the switchboard, even though the mechanical board had been completely isolated. Removing that relay caused the loss of all voltage, the  breakers for all the CRACs to open, and critical cooling to the data halls and UPS rooms to be lost. The problem was traced to a minor construction change to the Concurrently Maintainable design of a US$22-million data center.

•   In yet another instance, Uptime Institute discovered during a TCCF that a builder had fed power to a motorized building air supply and return using a single ATS, which would have defeated all critical cooling. The solution involved the application of multiple distributed damper control power ATS devices.

Fuel supply systems are also susceptible to construction errors. Generally diesel fuel for engine generators is pumped from bulk storage tanks through a control and filtration room to day tanks near the engine generators.

But in one instance, the fuel subcontractor built the system incorrectly and failed to do adequate quality control. The commissioning team also did not rigorously confirm that the system was built as designed, which is a major oversight. In fact, the commissioning agent was only manually testing the valves as the TCCF team arrived on site (see Figure 3). In this example, an experienced data center developer created an overly complex design for which the architect provisioned too little space. Operating the valves required personnel to climb on and over the piping. Much of the system was removed and rebuilt at the contractor’s expense. The owner also suffered adding project time and additional commissioning and TCCF testing after the fact.

Figure 3. A commissioning team operating valves manually to properly test a fuel supply system. Prior to Uptime Institute’s arrival for the TCCF, this task had not been performed.

Figure 3. A commissioning team operating valves manually to properly test a fuel supply system. Prior to Uptime Institute’s arrival for the TCCF, this task had not been performed.

AVOIDING CONSTRUCTION PROBLEMS

Once a design has been finalized and meets the OPR, change control processes are essential to managing and reducing risk during the construction phase. For various reasons, many builders, and even some owners, may be unfamiliar with the criticality of change control as it relates to data center projects. No project will be completely error free; however, good processes and documentation will reduce the number and severity of errors and sometimes make the errors that do occur easier to fix. Uptime Institute recommends that anyone contemplating a data center project take the following steps to protect against errors and other problems that can occur during construction.

Gather a design, construction, and project management team with extensive data center experience. If necessary bring in outside experts to focus on the OPR. Keep in mind that an IT group may not understand schedule risk or the complexity of a project. Experienced teams pushback on unrealistic schedules or VE suggestions that do not meet OPR, which prevents commissioning schedule compression and leads to good Operational Sustainability. In addition, experienced teams have data center operations and commissioning experience, which means that project changes will more likely benefit the owner. The initial costs may be higher, but experienced teams bring better ROI.

Because experienced teams understand the importance of data center specific Cx, the CxA will be able to work more effectively early in the process, setting the stage for the transition to operations. The Cx  requirements and focus on functionality will be clear from the start.

In addition, Operations should be part of the design and construction team from the start. Including Operations in change management gives it the opportunity to share and learn key information about how that data center will run, including set points, equipment rotation, change management, training, and spare inventory, that will be essential in every day operations and dealing with incidents.

Finally vendors should be a resource to the construction team, but almost by definition, their interests and those of the owner are not aligned.

Assembling an experienced team only provides benefits if they work as a team. The owner and owner’s representatives can encourage collaboration among team members who have divergent interests and strong  opinions by structuring contracts with designers, project engineering, and builders to prioritize meeting the OPR. Many data center professionals find that Design-Build or Design–Bid–Build using guaranteed maximum price (GMP) and sharing of cost savings contract types conducive to developing a team approach.

Third-party verifications can assure the owner that the project delivered meets the OPR. Uptime Institute has witnessed third-party verification improve contractor performance. The verifications motivate the contractors to work better, perhaps because verification increases the likelihood that shortcuts or corner  cutting will be found and repaired at the contractor’s expense. Uptime Institute does not believe that contractors, as a whole, engage in such activities, but it is logical that the threat of verification may make contractors more cautious about “interpreting contract language” and making changes that inexperienced project engineers and owner’s representatives may not detect.

Certifications and verifications are only effective when conducted by an unbiased, vendor-neutral third-party. Many certifications in the market fail to meet this threshold. Some certifications and verification processes are little more than a vendor stamp of approval on pieces of equipment. Others take a checklist approach, without examining causes of test failures. Worthwhile verification and certification approaches insist on identifying the causes of anomalous results, so they do not repeat in a live environment.

Similarly, the CxA should also be independent and not the designer or project engineer. In addition the Cx team should have extensive data center experience.

The CxA should focus on proving the design and installation meet OPR. The CxA should be just as inquisitive as the verification and certification agencies, and for the same reasons: if the root cause of abnormal performance during commissioning is not identified and addressed, it will likely recur during operations.

Third-party verifications and certifications provide peer review of design changes and VE. The truth is that construction is messy: On-site teams can get caught up in the demands of meeting budget and schedule and may lose site of the objective. A third-party resource that reviews major RFIs, VE, or design changes can keep a project on track, because an independent third-party can remain uninfluenced by project pressure.

TIER CERTIFICATION IS THE WRONG TIME TO FIND THESE PROBLEMS

Uptime Institute believes that the Tier Certification process is not the appropriate time to identify design and construction errors or to find that a facility is not Concurrently Maintainable or Fault Tolerant, as the owner may require. In fact, we note with alarm that a great number of the examples in this article were first identified during the Tier Certification process, at a time when correcting problems is most costly.

In this regard, then, the number of errors discovered during commissioning and Tier Certifications point out one value of third-party review of the design and built facility. By identifying problems that would have gone unnoticed until a facility failed, the third-party reviewer saves the enterprise a potentially existential incident.

More often, though, Uptime Institute believes that a well-organized construction process, including independent Level 4 and Level 5 Commissioning and Tier Certification, includes enough checks and balances to catch errors as early as possible and to eliminate any contractor incentive to “paper over” or minimize the need for corrective action when deviations from design are identified.

SIDEBAR: FUEL SUPPLY SYSTEM ISSUE OVERLOOKED DURING COMMISSIONING

Uptime Institute recently examined a facility that used DRUPS to meet the IT loads in a data center. The facility also had separate engine generators for mechanical loads. The DRUPS were located on the lower of two basement levels, with bulk fuel storage tanks buried outside the building. As a result, the DRUPS and daily tanks were lower than the actual bulk storage tanks.

The Tier Certification Constructed Facility (TCCF) demonstrations required that the building operate on engine-generator sets for the majority of the testing. During the day, the low fuel alarm tripped on multiple DRUPS.

UNDETECTED ISSUE

The ensuing investigation faulted the sequence of operations for the fuel transfer from the bulk storage tanks to the day tanks. When the day tanks called for fuel, the system would open the electrical solenoid valve at the day tank and delay the start of the fuel transfer pump to flow fuel. This sequence was intended to ensure the solenoid valve had opened so the pump would not deadhead against a closed valve.

Unfortunately, when the valve opened, gravity caused the fuel in the pipe to flow into the day tank before the pump started, which caused an automatic fuel leak detection valve to close. The fuel pump was pumping against a closed valve.

The fuel supply problem had not manifested previously, although the facility had undergone a number of commissioning exercises, because the engine-generator sets had not run long enough to deplete the fuel from the day tanks. In these exercises, the engine generators would run for a period of time and not start again until the next day. By then, the pumps running against the closed valve pushed enough fuel by the closed valves to refill the day tanks. The TCCF demonstrations caused the engine generators to run non-stop for an entire day, which emptied the day tanks and required the system to refill the day tanks in real time.

CORRECTIVE STEPS

The solution to this problem did not require drastic remediation, as sometimes occurs. Instead, engineers removed the time delay after the opening of the valve from the sequence of operation so that fuel could flow as desired.

MORAL OF THE STORY

Commissioning is an important exercise. It ensures that data center infrastructure is ready day one to support a facility’s mission and business objectives. Commissioning activities must be planned so that every system is required to operate under real-world conditions. In this instance, the engine-generator set runs were too brief to test the fuel system in a real-world condition.

TCCF brings another perspective, which made all the difference in this case. In the effort to test everything during commissioning, the big picture can be lost. The TCCF focuses on demonstrating each system works as a whole to support the overall objective of supporting the critical load.


Keith Klesner

Keith Klesner

Keith Klesner’s career in critical facilities spans 15 years. In the role of Uptime Institute Vice President of Strategic Accounts, Mr. Klesner has provided leadership and results-driven consulting for leading organizations around the world. Prior to joining Uptime Institute, Mr. Klesner was responsible for the planning, design, construction, operation, and maintenance of critical facilities for the U.S. government worldwide. His early career includes six years as a U.S. Air Force Officer. He has a Bachelor of Science degree in Civil Engineering from the University of Colorado- Boulder and a Masters in Business Administration from the University of LaVerne. He maintains status as a Professional Engineer (PE) in Colorado and is a LEED Accredited Professional.


The post Avoiding Data Center Construction Problems appeared first on Uptime Institute eJournal.

The Calibrated Data Center:  Using Predictive Modeling

$
0
0

Better information leads to better decisions
By Jose Ruiz

New tools have dramatically enhanced the ability of data center operators to base decisions regarding capacity planning and operational performance like move, adds, and changes on actual data. The combined use of modeling technologies to effectively calibrate the data center during the commissioning process and the use of these benchmarks in modeling prospective configuration scenarios enable end users to optimize the efficiency of their facilities prior to the movement or addition of a single rack.

Data center construction is expected to continue growing in coming years to house the compute and storage capacity needed to support the geometric increases in data volume that will characterize our technological environment for the foreseeable future. As a result, data center operators will find themselves under ever-increasing pressure to fulfill dynamic requirements in the most optimized environment possible. Every kilowatt (kW) of cooling capacity will become increasingly precious, and operators will need to understand the best way to deliver it proactively.

As Uptime Institute’s Lee Kirby explains in Start With the End in Mind, a data center’s ongoing operations should be the driving force behind its design, construction, and commissioning processes.

This paper examines performance calibration and its impact on ongoing operations. To maximize data center resources, Compass performs a variety of analyses using Future Facilities’ 6SigmaDC and Romonet’s Software Suite. In the sections that follow, I will discuss how predictive modeling during data center design, the commissioning process, and finally, the calibration processes validate the predictive models. Armed with the calibrated model, a customer can study the impact of proposed modifications on data center performance before any IT equipment is physically installed in the data center. This practice helps data center operators account for the three key elements during facility operations: availability, capacity, and efficiency. Compass calls this continuous modeling.

E Ruiz Figure 1 image1

Figure 1. CFD software creates a virtual facility model and studies the physics of the cooling and power elements of the data center

What is a Predictive Model?
A predictive model, in a general sense, combines the physical attributed and operating data of a system and uses that to calculate an outcome in the future. The 6Sigma model provides complete 3D representation of a data center at any given point in its life cycle. Combining the physical elements of IT equipment, racks, cables, air handling units (AHUs), power distribution units (PDUs), etc., with computational fluid dynamics (CFD) and power modeling, enables designers and operators to predict the impact of their configuration on future data center performance. Compass uses commercially available performance modeling and CFD tools to model data center performance in the following ways:

• CFD software creates a virtual facility model and studies the physics of the cooling and power elements of the data center (see Figure 1).

• The modeling tool interrogates the individual components that make up the data center and compare their actual performance with the initial modeling prediction.

This proactive modeling process allows operators to fine tune performance and identify potential operational issues at the component level. A service provider, for example, could use this process to maximize the sellable capacity of the facility and/or its ability to meet the service level agreements (SLA) requirements for new as well as existing customers.

Case Study Essentials

For the purpose of this case study all of the calibrations and modeling are based upon Compass Data Center’s Shakopee, MN, facility with the following specifications (see Figure 2):

• 13,000 square feet (ft2) of raised floor space

• No columns on the data center floor

• 12-foot (ft) false ceiling used as a return air
plenum

• 36-inch (in.) raised floor

• 1.2 megwatt (MW) of critical IT load

• four rooftop air handlers in an N+1 configuration

• 336 perforated tiles (25% open) with dampers installed

• Customer type: service provider

E Ruiz Figure 2 image2

Figure 2. Data center room with rooftop AHUs


Cooling Baseline
The cooling system of this data center comprises  4 120-ton rooftop air handler units in an N+1 configuration (see Figure 3). The system provides a net cooling capacity that a) supports the data center’s 1.2-MW power requirement and b) delivers 156,000 cubic feet per minute (CFM) of airflow to the white space. The cooling units are controlled based on the total IT load present in the space. This method turns on AHUs as the load increases. Table 1 describes the scheme.

table1

Table 2. Tests performed during calibration

These units have outside air economizers to leverage free cooling and increase efficiency. For the purpose of the calibration, the system was set to full recirculation mode with the outside air economization feature turned off. This allows the cooling system to operate at 100% mechanical cooling, which is representative of a standard operating day under the Design Day conditions.

E Ruiz Figure 3 image3

Figure 3. Rooftop AHUs

E Ruiz Figure 4 image4

Figure 4. Cabinet and perforated tile layout.  Note: Upon turnover, the customer is responsible for racking and stacking the IT equipment.

Cabinet Layout
The default cabinet layout is based on a standard Cold Aisle/Hot Aisle configuration (see Figure 4).

Airflow Delivery and Extraction
Because the cooling units are effectively outside the building, a long opening on one side of the room serves as a supply air plenum. The air travels down the 36-in.-wide plenum to a patent-pending air dam before entering the raised floor. The placement of the air dam ensures even pressurization of the raised floor during both normal and maintenance failure modes. Once past the air dam, the air enters a 36-in. raised floor and is released into the above floor by 336 perforated tiles (25% open) (see Figure 5).

Figure 5. Airflow

Figure 5. Airflow

Hot air from the servers then passes through ventilation grilles placed in the 12-ft false ceiling.

Commissioning and Calibration
Commissioning is a critical step in the calibration process because it eliminates extraneous variables that may affect subsequent reporting values. Upon the completion of the Integrated Systems Testing (IST), the calibration process begins. This calibration exercise is designed to enable the data center operator to compare actual data center performance against the modeled values.

E Ruiz Figure 6image6

Figure 6. Inconsistencies between model values and actual performance can be explored and examined prior to placing the facility into actual operation. These results provide a unique insight into whether the facility will operate as per the design intent in the local climate.

The actual process consists of conducting partial load tests in 25% increments and monitoring actual readings from specific building management system points, sensors, and devices that account for all the data center’s individual components.

E Ruiz Figure 7 image11

Figure 7. Load bank and PDUs during the test

As a result of this testing, inconsistencies between model values and actual performance can be explored and examined prior to placing the facility into actual operation. These results provide a unique insight into whether the facility will operate as per the design intent in the local climate or whether there are issues that will affect future operation that must be addressed. Figure 6 shows the process. Figure 7 shows load banks and PDUs as arranged for testing.

table2

Table 2. Tests performed during calibration

All testing at Shakopee was performed by a third-party entity to eliminate the potential for any reporting bias in the testing. The end result of this calibration exercise is that the operator now has a clear understanding of the benchmark performance standards unique to their data center. This provides specific points of reference for all future analysis and modeling to determine the prospective performance impact of site moves, adds, or changes. Table 2 lists the tests performed during the calibration.

table3

Table 3. Perforated tile configuration during testing

During the calibration, dampers on appropriate number of tiles were closed proportionally to coincide with the load step. Table 3 shows the perforated tile damper configuration used during the test.

table4

Table 4. CPM goals, test results, and potential adjustments

Analysis & Results
To properly interpret the results of the initial calibration testing, it’s important to understand the concept of cooling path management (CPM), which is the process of stepping through the full route taken by the cooling air and systematically minimizing or eliminating potential breakdowns. The ultimate goal of this exercise is meeting the air intake requirement for each unit of IT equipment. The objectives and associated changes are shown in Table 4.

Cooling paths are influenced by a number of variables, including the room configuration, IT equipment and its arrangement, and any changes that will fundamentally change the cooling paths. In order to proactively avoid cooling problems or inefficiencies that may creep in over time, CPM is, therefore, essential to the initial design of the room and to configuration management of the data center throughout its life span.

AHU Fans to Perforated Tiles (Cooling Path #1). CPM begins by tracing the airflow from the source (AHU fans) to the returns (AHU returns). The initial step consists of investigating the underfloor pressure. Figure 8 shows the pressure distribution in the raised floor. In this example, the underfloor pressure is uniform from the very onset; thereby, ensuring an even flow rate distribution.

E Ruiz Figure 8 image12

Figure 8 shows the pressure distribution in the raised floor. In this example, the underfloor pressure is uniform from the very onset; thereby, ensuring an even flow rate distribution.

From a calibration perspective, Figure 9 demonstrates that the results obtained from the simulation are aligned with the data collected during commissioning/calibration testing. The average underfloor pressure captured by software during the commissioning process was 0.05 in. of H20 as compared to 0.047 in. H20 predicted by 6SigmaDC.

The airflow variation across the 336 perforated tiles was determined to be 51 CFM. These data guaranteed an average target cooling capacity of 4 kW/cabinet compared to the installed 3.57 kW/cabinet (assuming that the data center operator uses the same type of perforated tiles as those initially installed). In this instance, the calibration efforts provided the benchmark for ongoing operations, and verified that the customer target requirements could be fulfilled prior to their taking ownership of the facility.

The important takeaway in this example is the ability of calibration testing to not only validate that the facility is capable of supporting its initial requirements but also to offer the end user a cost-saving mechanism to determine the impact of proposed modifications on the site’s performance, prior to their implementation. In short, hard experience no longer needs to be the primary mode of determining the performance impact of prospective moves, adds, and changes.

Table 5. Airflow simulations and measured results

Table 5. Airflow simulations and measured results

During the commissioning process, all 336 perforated tiles were measured.

Table 5 is a results comparison of the measured and simulated flow from the perforated tiles.

table6

Table 6. Airflow distribution at the perforated tiles

The results show a 1% error between measured and simulated values. Let’s take a look at the flow distribution at the perforated tiles (see Table 6).

The flows appear to match up quite well. It is worth noting that the locations of the minimum and maximum flows are different between measured and simulated values. However, this is not of concern as the flows are within an acceptable margin of error. Any large discrepancy (> 10%) between simulated and measured would warrant further investigation (see Table 7). The next step in the calibration process examined the AHU supply temperatures.

Perforated Tiles to Cabinets (Cooling Path #2). Perforated tile to cabinet airflow (see Figure 10) is another key point of reference that should be included in calibration testing and determination. Airflow leaving the perforated tiles enters the inlets of the IT equipment with minimal bypass.

E Ruiz Figure 9 image13

Figure 9. Simulated flow through the perforated tiles

E Ruiz Figure 10 ?image14

Figure 10. The blue particles cool the IT equipment, but the gray particles bypass the equipment.

Figure 10 shows how effective the perforated tiles are in terms of delivering the cold air to the IT equipment. The blue particles cool the IT equipment while the gray particles bypassing the equipment.

A key point of this testing is the ability to proactively identify solutions that can increase efficiency. For example, during this phase, testing helped determine that reducing fan speed would improve the site’s efficiency. As a result, the AHU fans were fitted with variable frequency drives (VFDs), which enables Compass to more effectively regulate this grille to cabinet airflow.

E Ruiz Figure 11 image15

Figure 11. Inlet temperatures

It was also determined that inlet temperatures to the cabinets were on the lower scale of the ASHRAE allowable range (see Figure 11), this creating the potential to raise the air temperature within the room for operations. If the operator takes action and raises the supply air temperature, they will have immediate efficiency gains and see significant cost savings.

table8

Table 8. Savings estimates based on IT loads

The analytical model  can estimate these savings quickly. Table 8 shows the estimated annual cost savings based on IT load, supply air temperature setting for the facility and a power cost of seven cents per kilowatt-hour (U.S. national average). It is important to note the location of the data center because the model uses specific EnergyPlus TMY3 weather files published by the U.S. Department of Energy for its calculation.

E Ruiz Figure 12 image16

Figure 12. Cooling path three tracks airflow from the equipment exhaust to the returns of the AHU units

Cabinet Exhaust to AHU Returns (Cooling Path #3). Cooling path three tracks airflow from the equipment exhaust to the returns of the AHU units (see Figure 12). In this case, calibration testing identified that the inlet temperatures suggest that there was very little external or internal cabinet recirculation. The return temperatures and the capacities of the AHU units are fairly uniform. The table  shows the comparison between measured and simulated AHU return temperatures:

Looking at the percentage cooling load utilized for each AHU unit, the measured load was around 75% and the simulated values show an average value of 80% for each AHU. This slight discrepancy was acceptable due to the differences between the measured and simulated supply and return temperatures; thereby, establishing the acceptable parameters for ongoing operation within the site.

Introducing Continuous Modeling
Up to this point, I have illustrated how calibration efforts can be used to both verify the suitability of the data center to successfully perform as originally designed  and to prescribe the specific benchmarks for the site. This knowledge can be used to evaluate the impact of future operational modifications, which is the basis of continuous modeling.

The essential value of continuous modeling is its ability to facilitate more effective capacity planning. By modeling prospective changes before moving IT equipment in, a lot of important what-if’s can be answered (and costs avoided) while meeting all the SLA requirements.

Examples of continuous modeling applications include, but are not limited to:

• Creating custom cabinet layouts to predict the impact of various configurations

• Increasing cabinet power density or modeling custom cabinets

• Modeling Cold Aisle/Hot Aisle containment

• Changing the control systems that regulate VFDs to move capacity where needed

• Increasing the air temperature safely without breaking the temperature SLA

• Investigating upcoming AHU maintenance or AHU failures that can’t be achieved in a production environment

In each of these applications, the appropriate modeling tools are used in concert with initial calibration data to determine the best method of implementing a desired change. The ability to proactively identify the level of deviation from the site’s initial system benchmarks can aid in the identification of more effective alternatives that not only improve operational performance but also reduce the time and cost associated with their implementation.

Case History: Continuous Modeling
Total airflow in the facility described in this case study is based on the percentage of IT load in the data hall with a design criteria of 25°F (-4°C) ∆T. Careful tile management must be practiced in order to maintain proper static pressure under the raised floor and avoid potential hot spots. Using the calibrated model, Compass created two scenarios to understand the airflow behavior. This resulted in installing fewer perforated tiles than originally planned and better SLA compliance. Having the calibrated model gave a higher level of confidence for the results. The two scenarios are summarized following.

E Ruiz Figure 15 image19

Figure 13. Case history equipment layout

Scenario 1: Less Than Ideal Management
There are 72 4-kW racks in one area of the raised floor and six  6 20-kW racks in the opposite corner (see Figure 13). The total IT load is 408 kW, which is equal to 34% of the total IT load available. The total design airflow at 1,200 kW is 156,000 CFM, meaning the total airflow delivered in this example is 53,040 CFM. A leakage rate of 12% is assumed, which means that 88% of the 53,040 CFM is distributed using the perforated tiles. Perforated tiles were provided in front of each rack. The 25% open tiles were used in front of the 4-kW racks and Tate GrateAire tiles were used in front of the 20-kW racks.

E Ruiz Figure 16 image20

Figure 14. Scenario 1 data hall temperatures

The results of Scenario 1 demonstrate the temperature differences between the hot and cold aisles. For the area with 4-kW racks there is an average temperature difference of around 10°F (5.5 °C) between the Hot and Cold aisles, and the 20-kW racks have a temperature difference of around 30°F (16°C) (see Figure 14).

Scenario 2: Ideal Management
In this scenario, the racks were left in the same location, but the perforated tiles were adjusted to better distribute air based on the IT load. The 20-kW racks account for 120 kW of the total IT load while the 4-kW racks account for 288 kW of the total IT load. In an ideal floor layout, 29.4% of the airflow will be delivered to the 20-kW racks and 70.6% of the airflow will be delivered to the 4-kW racks. This will allow for an ideal average temperature difference across all racks.

E Ruiz Figure 17 image21

Figure 15. Scenario 2 data hall temperatures

Scenario 2 shows a much better airflow distribution than Scenario 1. The 20-kW racks now have around 25°F (14°C) difference between the hot and cold aisles (see Figure 15).

In general, it may stand to reason that if there are a total of 336 perforated tiles in the space and the space is running at 34% IT load, 114 perforated tiles should be open. The model validated that if 114 perforated tiles were opened, the underfloor static pressure would drop off and potentially cause hot spots due to lack of airflow.

Furthermore, continuous modeling will allow operators a better opportunity to match growth with actual demand. Using this process, operators can validate capacity and avoid wasted capital expense due to poor capacity planning.

Conclusion
To a large extent, a lack of evaluative tools has historically forced data center operators to accept on faith their new data center’s ability to meet its design requirements. Recent developments in modeling applications not only address this long-standing short coming, but also provide operators with an unprecedented level of control. The availability of these tools provide end users with proactive analytical capabilities that manifest themselves in more effective capacity planning and efficient data center operation.

table10

Table 9. Summary of the techniques used to develop in each step of model development and verification

Through the combination of rigorous calibration testing, measurement, and continuous modeling, operators can evaluate the impact of prospective operational modifications prior to their implementation and ensure that they are cost-effectively implemented without negatively affecting site performance. This enhanced level of control is essential for effectively managing data centers in an environment that will continue to be characterized by its dynamic nature and increasing application complexity. Finally, Table 9 summarizes the reasons why these techniques are valuable and provide a positive impact in data center operations.

Most importantly, all of these help the data center owner and operator make a more informed decision.


Jose Ruiz

Jose Ruiz

Jose Ruiz is an accomplished data center professional with a proven track record of success. Mr. Ruiz serves as Compass Datacenters’ director of Engineering where he is responsible for all of the company’s sales engineering and development support activities. Prior to joining Compass, he spent four years serving in various sales engineering positions and was responsible for a global range of projects at Digital Realty Trust. Mr. Ruiz is an expert on CFD modeling.

Prior to Digital Realty Trust, Mr. Ruiz was a pilot in the United States Navy where he was awarded two Navy Achievement Medals for leadership and outstanding performance. He continues to serve in the Navy’s Individual Ready Reserve. Mr. Ruiz is a graduate of the University of Massachusetts with a degree in Bio-Mechanical Engineering.


The post The Calibrated Data Center:  Using Predictive Modeling appeared first on Uptime Institute eJournal.

Meeting the M&O Challenge of Managing a Diverse Data Center Footprint: John Sheputis and Don Jenkins, Infomart

$
0
0

By Matt Stansberry and Lee Kirby

Driving operational excellence across multiple data centers is exponentially more difficult than managing just one. Technical complexity multiplies as you move to different sites, regions, and countries where codes, cultures, climates and other factors are different. Organizational complexity further complicates matters when the data centers in your portfolio have different business requirements.

With little difficulty, an organization can focus on staffing, maintenance planning and execution, training and operations for a single site. Managing a portfolio turns the focus from projects to programs and from activity to outcomes. Processes become increasingly complex and critical. In this series of interviews, you will hear from practitioners about the challenges and lessons they have drawn from their experiences. You will find that those who thrive in this role share the understanding that Operational Excellence is not an end state, but a state of mind.

This interview is part of a series of conversations with executives who are managing diverse data center portfolios. The interviewees in this series participated in a panel at Uptime Institute Symposium 2015, discussing their use of the Uptime Institute Management & Operations (M&O) Stamp of Approval to drive standardization across data center operations.

John Sheputis: President, Infomart Data Centers

Don Jenkins: VP Operations, Infomart Data Centers

Give our readers a sense of your current data center footprint.

Sheputis: The portfolio includes about 2.2 million square feet (ft2) of real estate, mostly data center space. The facilities in both of our West Coast locations are data center exclusive. The Dallas facility is enormous, at 1.6 million ft2, and is a combination of mission critical and non-mission critical space. Our newest site in Ashburn, VA, is 180,000 ft2 and undergoing re-development now, with commissioning on the new critical load capacity expected to complete early next year.

The Dallas site has been operational since the 1980s. We assumed the responsibility for the data center pods in that building in Q4 2014 and brought on staff from that site to our team.

What is the greatest challenge of managing your current footprint?

Jenkins: There are several challenges, but communicating standards across the portfolio is a big one. Also, different municipalities have varying local codes and governmental regulations. We need to adapt our standards to the different regions.

For example, air quality control standards vary at different sites. We have to meet very high air quality standards in California, which means we adhere to very strict requirements for engine-generator runtimes and exhaust filter media. But in other locations, the regulations are less strict, and that variance impacts our maintenance schedules and parts procurement.

Sheputis: It may sound trivial to go from an area where air quality standards are high to one that is less stringent, but it still represents a change in our standards. If you’re going to do development, it’s probably best to start in California or somewhere with more restrictive standards and then go somewhere else. It would be very difficult to go the other way.

More generally, the Infomart merger was a big bite. It includes a lot of responsibility for non-data center space. So now we have two operating standards. We have over 500,000 ft2 of office-use real estate that uses the traditional break-fix operation model. We also have over two dozen data center suites with another 500,000 ft2 of mission critical space as well, where nothing breaks, or if it does, there can be no interruption of service. These different types of property have two different operations objectives and require different skill sets. Putting those varying levels of operations under one team expands the number of challenges you absorb. It pushes us from managing a few sites to a “many sites” level of complexity.

How do you benchmark performance goals?

Sheputis: I’m going to restrict my response to our mission critical space. When we start or assume control of a project, we have some pretty unforgiving standards. We want concurrent maintenance, industry-leading PUE, on time, on budget, and no injuries—and we want our project to meet critical load capacity and quality standards.

But picking up somebody else’s capital project after they‘ve already completed their design and begun the work, yet before they finished? That is the hardest thing in the world. The Dallas Infomart site is so big, there are two or three construction projects going on at any time. Show up any weekend, and you’ll somebody is doing a crane pick or has a helicopter delivering some equipment to be installed on the roof. It’s that big. It’s a damn good thing that we have great staff on site in Dallas and someone like Don Jenkins to make sure everything goes smoothly.

We hear a lot about data center operations staffing shortages. What has been your experience at Infomart?

Jenkins: Good help is hard to find anywhere. Data center skills are very specific. It’s a lot harder to find good data center people. One of the things we try to do is hire veterans. Over half our operating engineers have military backgrounds, including myself. We do this not just out of patriotism or to meet security concerns, but because we understand and appreciate the similarity of a mission critical operation and a military operation (see http://journal.uptimeinstitute.com/resolving-data-center-staffing-shortage/).

Sheputis: If you have high standards, there is always a shortage of people for any job. But the corollary for that is that if you’re known for doing your job very well, the best people often find you. Don deserves credit for building low turnover teams. Creating a culture of continuity requires more than strong technical skillsets, you have to begin recruiting the kinds of people who can play on a team.

Don uses this phrase a lot to describe the type he’s looking for—people who are capable of both leading and being led. He wants candidates with low egos who care about outcomes, strong ethics, and who want to learn. We invest heavily in our training program, and we are rigorous in finding people who buy into our process. We don’t want people who want to be heroes. The ideal candidate is a responsible team player with an aptitude for learning, and we fill in the technical gaps as necessary over time. No one has all the skills they need day one. Our training is industry leading. To date, we have had no voluntary turnover.

Jenkins: We do about 250 man-hours of training for each staff member. It’s not cheap, but we feel it’s necessary and the guys love it. They want to learn. They ask for it. Greater skill attainment is a win-win for them, our tenants, and us.

Sheputis: When you build a data center, you often meet the technically strongest people at either the beginning of the project during design or the end of the project during the commissioning phase. Every project we do is Level 5 Commissioned. That’s when you find and address all of the odd or unusual use cases that the manufacturer may not have anticipated. More than once, we have had a UPS troubleshooting specialist say to Don, “You guys do it right. Let me know when you have an opening in your organization.”

Jenkins: I think it’s a testament that shows how passionate we are about what we do.

Are you standardizing management practices across multiple sites?

Sheputis: When we had one or two sites, it wasn’t a challenge because we were copying from California to Oregon. But with three or more sites it becomes much more difficult. With the inclusion of Dallas and Ashburn, we have had to raise our game. It is tempting to say we do the same thing everywhere, but that would be unrealistic at best.

Broadly speaking, we have two families of standards: Content and Process. For functional content we have specs for staffing, maintenance, security, monitoring, and the like. We apply these with the knowledge that there will be local exceptions—such as different codes and different equipment choices. An operator from one site has to appreciate the deviations at the other sites. We also have process-based standards, and these are more meticulously applied across sites. While the OEM equipment may be different, shouldn’t the process for change management be consistent? Same goes for the problem management process. Compliance is another area where consistency is expected.

The challenge with projecting any standard is to efficiently create evidence of acceptance and verification. We try to create a working feedback loop, and we are always looking for ways to do it better. We can centrally document standard policies and procedures, but we rely on field acceptance of the standard, and we leverage our systems to measure execution versus expectation. We can say please complete work orders on time and to the following spec, and we can delegate scheduling to the field, but the loop isn’t complete until we confirm execution and offer feedback on whether the work and documentation were acceptable.

What technology or methodology has helped your organization to significantly improve data center management?

Jenkins: Our standard building management system BMS is a Niagaraproduct with an open framework. This allows our legacy equipment to talk over open protocols. All of our dashboards and data look the same and feel the same across all of the sites so that anybody could pull up another site and it would look the same to the operator.

Sheputis: Whatever system you’re using, there has to be a high premium on keeping it open. If you run on a closed system, it eventually becomes a lost island. This is especially true as you scale your operation. You have to have open systems.

How does your organization use the M&O Stamp?

Sheputis: The M&O stamp is one of the most important things we have ever achieved. And I’m not saying this to flatter you or the Uptime Institute. We believe data center operations are very important, and we have always believed we were pretty good. But I have to believe that many operators think they do a good job as well. So who is right? How does anyone really know? The challenge to the casual observer is that the data center industry is fairly closed. Operations are secure and private.

We started the process to see how good we were, and if we were good, we also thought it would be great to have a credible third party to acknowledge that. Saying I think I’m good is one thing, having a credentialed organization like Uptime Institute say so is much more.

But the M&O process is more than the Stamp of Approval. Our operations have matured and improved by participating in this process. Every year we reassess and recertify we feel like we learn new things, and we’re tracking our progress. The bigger benefit may be that the process forces us to think procedurally. When we’re setting up a new site, it helps us set a roadmap for what we want to achieve. Compared to all other forms of certification, we get something out of this beyond the credential; we get a path to improve.

Jenkins: Lots of people run a SWOT (strengths, weaknesses, opportunities, and threats) analysis or internal audit, but that feedback often lacks external reference points. You can give yourself an audit, and you can say “we’re great.” But what are you learning? How do you expand your knowledge? The M&O Stamp of Approval provides learning opportunities for us by providing a neutral experienced outsider viewpoint on where, and more importantly, how we can do better.

On one of the assessments, one of Uptime Institute’s consultants demonstrated how we could setup our chiller plant so that an operator could see all the key variables easily at a glance, with fewer steps to see what valves are open or closed. The advice was practical and easy to implement. Including markers on a chain, little flags on a chiller, LED lights on a pump. Very simple things to do, but we hadn’t thought of it. They’d seen it in Europe, it was easy to do, and it helps. That’s one specific example, but we used the knowledge of the M&O team to help us grow.

We think the M&O criteria and content will get better and deeper as time goes on. This is a solid standard for people to grow on.

Sheputis: We are for certifications, as they remove doubt, but most of the work and value is had in obtaining the first certification. I can see why others are cynical about value and cost to recertify. But I do think there’s real value in the ongoing M&O certification, mainly because it shows continuous improvement. No other certification process does that.

Jenkins: A lot of certifications are binary in that you pass if you have enough checked boxes—the content is specific, but operationally shallow. We feel that we get a lot more content out of the M&O process.

Sheputis: As I said before, we are for compliance and transparency. As we are often fulfilling a compliance requirement for someone else, there is clear value is saying we are PCI compliant or SSAE certified. But the M&O Stamp of Approval process is more like seeing a professional instructor. All other certifications should address the M&O stamp as “Sir.”


matt-stansberry

Matt Stansberry

Matt Stansberry is director of Content and Publications for the Uptime Institute and also serves as program director for the Uptime Institute Symposium, an annual spring event that brings together 1,500 stakeholders in enterprise IT, data center facilities, and corporate real estate to deal with the critical issues surrounding enterprise computing. He was formerly editorial director for Tech Target’s Data Center and Virtualization media group, and was managing editor of Today’s Facility Manager magazine. He has reported on the convergence of IT and Facilities for more than a decade.


The post Meeting the M&O Challenge of Managing a Diverse Data Center Footprint: John Sheputis and Don Jenkins, Infomart appeared first on Uptime Institute eJournal.

AIG Tells How It Raised Its Level of Operations Excellence

$
0
0

By Kevin Heslin and Lee Kirby

Driving operational excellence across multiple data centers is exponentially more difficult than managing just one. Technical complexity multiplies as you move to different sites, regions, and countries where codes, cultures, climates, and other factors are different. Organizational complexity further complicates matters when the data centers in your portfolio have different business requirements.

With little difficulty, an organization can focus on staffing, maintenance planning and execution, training and operations for a single site. Managing a portfolio turns the focus from projects to programs and from activity to outcomes. Processes become increasingly complex and critical. In this series of interviews, you will hear from practitioners about the challenges and lessons they have drawn from their experiences. You will find that those who thrive in this role share the understanding that Operational Excellence is not an end state, but a state of mind.

This interview is part of a series of conversations with executives who are managing diverse data center portfolios. The interviewees in this series participated in a panel at Uptime Institute Symposium 2015, discussing their use of the Uptime Institute Management & Operations (M&O) Stamp of Approval to drive standardization across data center operations.

Herb Alvarez: Director of Global Engineering and Critical Facilities
American International Group

An experienced staff was empowered to improve infrastructure, staffing, processes, and programs

What’s the greatest challenge managing your current footprint?

Providing global support and oversight via a thin staffing model can be difficult, but due to the organizational structure and the relationship with our global FM alliance partner (CBRE) we have been able to improve service delivery, manage cost, and enhance reliability. From my perspective, the greatest challenges have been managing the cultural differences of the various regions, followed by the limited availability of qualified staffing in some of the regions. With our global FM partner, we can provide qualified coverage for approximately 90% of our portfolio; the remaining 10% is where we see some of these challenges.


Do you have reliability or energy benchmarks?

We continue to make energy efficiency and sustainability a core requirement of our data center management practice. Over the last few years we retrofitted two existing data center pods at our two global data centers and we replaced EOL (end of life) equipment with best-in-class, higher efficiency systems. The UPS systems that we installed achieve a 98% efficiency rating while operating in ESS mode and 94 to 96% rating while operating in VMMS mode. In addition, the new cooling systems were installed with variable flow controls and VFDs for the chillers, pumps, and CRAHs. Including full cold aisle containment as well as multiple control algorithms to enhance operating efficiency. Our target operating model for the new data center pods was to achieve a Tier III level of reliability along with a 1.75 PUE, and we achieved both of these objectives. The next step on our energy and sustainability path is to seek Energy Star and other industry recognitions.


Can you tell me about your governance model and how that works?

My group in North America is responsible for the strategic direction and the overall management for the critical environments around the world. We set the standards (design, construction, operations, etc.), guidelines, and processes. Our regional engineering managers, in turn, carry these, out at the regional level. At the country level, we have the tactical management (FM) that ultimately implements the strategy. We subscribe to a system of checks and balances, and we have incorporated global and regional auditing to ensure that we have consistency throughout the execution phase. We also incorporate KPIs to promote the high level of service delivery that we expect.


From your perspective, what is the greatest difficulty in making that model work, ensuring that the design ideas are appropriate for each facility, and that they are executed according to your standards?

The greatest difficulties encountered were attributed to the cultural differences between regions. Initially, we encountered some resistance at the international level in regards to broad acceptance of design standards and operating standards. However, with the support of executive senior leadership and the on-going consolidation effort, we achieved global acceptance through a persistent and focused effort. We now have the visibility and oversight to ensure that our standards and guidelines are being enforced across the regions. It is important to mention that our standards, although rigid, do have flexible components embedded in them due to the fact that a “one size fits all” regimen is not always feasible. For these instances, we incorporated an exception process that grants the required flexibility to deviate from a documented standard. In terms of execution, we now have the ability via “in-country” resources to validate designs and their execution.

It also requires changing the culture, even within our own corporate group. For example, we have a Transactions group that starts the search for facilities. Our group said that we should only be in this certain type of building, this quality of building, so we created some standards and minimum requirements. We said, “We are AIG. We are an insurance company. We can’t go into a shop house.” This was a cultural change, because Transactions always looked for the lowest cost option first.

The AIG name is at stake. Anything we do that is deficient has the potential to blemish the brand.


Herb, it sounds like you are describing a pretty successful program. And yet, I am wondering if there are things that you would do differently if you starting from scratch.

If it were a clean slate, and a completely new start, I would look to use an M&O type of assessment at the onset of any new initiatives as it relates to data center space acquisition. Utilizing M&O as a widely accepted and recognized tool would help us achieve consistency across data centers and would validate colo provider capabilities as it relates to their operational practices.


How do M&O stamps help the organization, and which parts of your operations do they influence the most?

I see two clear benefits. From the management and operations perspective, the M&O Stamp offers us a proven methodology of assessing our M&O practice, not only validating our program but also offering a level of benchmarking against other participants of the assessments. The other key benefit is that the M&O stamp helps us promote our capabilities within the AIG organization. Often, we believe that we are operationally on par with the industry, but a third-party validation from a globally accepted and recognized organization helps further validate our beliefs and our posture as it relates to the quality of the service delivery that we provide. We look at the M&O stamp as an on-going certification process that ensures that we continually uphold the underlying principles of management and operations excellence, a badge of honor if you will.


AIG has been awarded two M&O Stamps of Approval in the U.S. I know you had similar scores on the two facilities. Were the recommendations similar?

I expected more commonality between both of the facilities. When you have a global partner, you expect consistency across sites. In these cases, there were about five recommendations for each site; two of them were common to both sites. The others were not. It highlighted the need for us to re-assess the operation in several areas, and remediate where necessary.


Of course you have way more than two facilities. Were you able to look at those reports and those recommendations and apply them universally?

Oh, absolutely. If there was a recommendation specific to one site, we did not look at it just for that site. We looked to leverage that across the portfolio. It only makes sense, as it applies to our core operating principals of standardizing across the portfolio.


Is setting KPIs for operations performance part of your FM vendor management strategy?

KPIs are very important to the way we operate. They allow us to set clear and measureable performance indicators that we utilize to gauge our performance. The KPIs drive our requirement for continuous improvement and development. We incentivize our alliance partner and its employees based on KPI performance, which helps drive operational excellence.


Who do you share the information with and who holds you accountable for improvements in your KPIs?

That’s an interesting question. This information is shared with our senior management as it forms our year-over-year objectives and is used as a basis for our own performance reviews and incentive packages. We review our KPIs on an on-going basis to ensure that we are trending positively; we re-assess the KPIs on an annual basis to ensure that they remain relevant to the desired corporate objectives. During the last several years one of our primary KPIs has been to drive cost reductions to the tune of 5% reductions across the portfolio.


Does implementing those reductions become part of staff appraisals?

For my direct reports, the answer is yes. It becomes part of their annual objectives, they have to be measurable and we have to agree that they are achievable. We track progress on a regular basis and communicate progress via our quarterly employee reviews. Again, we are very careful that any such reductions do not adversely impact our operations or detract us from achieving our uptime requirements.


Do you feel that AIG has mastered demand management so you can effectively plan, deploy, and manage capacity at the speed of the client?

I think that we have made significant improvements over the last few years in terms of capacity planning, but I do believe that this is an area where we can still continue to improve. Our capacity planning team does a very good job of tracking, trending, and projecting workloads. But there is ample opportunity for us to become more granular on the projections side of the reporting, so that we have a very clear and transparent view of what is planned, its anticipated arrival, and its anticipated deployment time line. We recognize that we all play a role, and the expectation is that we will all work collaboratively to implement these types of enhancements to our demand/capacity management practice.


So you are viewing all of this as a competitive advantage.

You have to. That’s a clear objective for all of senior management. We have to have a competitive edge in the marketplace, whether that’s on the technology side, product side, or how we deliver services to our clients. We need to be best in class. We need to champion the cause and drive this message throughout the organization.


Staffing is a huge part of maintaining data center operational excellence. We hear from our Network members that finding and keeping talent is a challenge. Is this something you are seeing as well?

I definitely do think there is a shortage of data center talent. We have experienced this first hand. I do believe that the industry needs to have a focused data center education program to train data center personnel. I am not referring to the theoretical or on-line programs, which already exist, but hands-on training that is specific to data center infrastructure. Typical trade school programs focus on general systems and equipment but do not have a track that is specific to data centers, one that also includes operational practices in critical environments. I think there has got to be something in the industry that’s specialized and hands-on. Training that covers the complex systems found in data centers, such as UPS systems, switchgear, EPMS, BMS, fire suppression, etc.


How do you retain your own good talent?

Keep them happy, keep them trained, and above all keep it interesting. You have to have a succession track, a practice that allows growth from within but also accounts for employee turnover. The succession track has to ensure that we have operational continuity when a team member moves on to pursue other opportunities.

The data center environment is a very demanding environment, and so you have to keep staff members focused and engaged. We focus on building a team, and as part of team development we ensure team members are properly trained and developed to the point where we can help them achieve their personal goals, which often times includes upward mobility. Our development track is based on the CBRE Foundations training program. In addition to the training program, AIG and CBRE provide multiple avenues for staff members to pursue growth opportunities.


When the staff is stable, what kinds of things can you do to keep them happy when you can’t promote them?

Oftentimes, it is the small things you do that resonate the most. I am a firm believer that above-average performance needs to be rewarded. We are pro-active and at times very creative in how we acknowledge those that are considered top performers. The Brill Award, which we achieved as a team, is just one example. We acknowledged the team members with a very focused and sincere thank you communication, acknowledging not only their participation but also the fact that it could not have been achieved without them. From a senior management perspective, we can’t lose sight of the fact that in order to cultivate a team environment you have to be part of the team. We advocate for a culture of inclusion, development, and opportunity.


Herb Alvarez

Herb Alvarez

Herb Alvarez is director of Global Engineering & Critical Facilities, American International Group. Inc. Mr. Alvarez is responsible for engineering and critical facilities management for the AIG portfolio, which comprises 970 facilities spread across 130 countries. Mr. Alvarez has overarching responsibility for the global data center facilities and their building operations. He works closely and in collaboration with AIG’s Global Services group, which is the company’s IT division.

AIG operates three purpose-built data centers in the U.S., including a 235,000 square foot (ft2) facility in New Jersey and a 205,000-ft2 facility in Texas, and eight regional colo data centers in Asia Pacific, EMEA, and Japan.

Mr. Alvarez helped implement a consolidation and standardization effort Global Infrastructure Utility (GIU) that AIG’s CEO Robert Benmosche implemented in 2010. This initiative was completed in 2013.


Kevin Heslin

Kevin Heslin

Kevin Heslin is chief editor and director of ancillary projects at the Uptime Institute. He served as an editor at New York Construction News, Sutton Publishing, the IESNA, and BNP Media, where he founded Mission Critical, the leading commercial publication dedicated to data center and backup power professionals. In addition, Heslin served as communications manager at the Lighting Research Center of Rensselaer Polytechnic Institute. He earned the B.A. in Journalism from Fordham University in 1981 and a B.S. in Technical Communications from Rensselaer Polytechnic Institute in 2000.


The post AIG Tells How It Raised Its Level of Operations Excellence appeared first on Uptime Institute eJournal.

IT Chargeback Drives Efficiency

$
0
0

Allocating IT costs to internal customers improves accountability, cuts waste

By Scott Killian

You’ve heard the complaints many times before: IT costs too much. I have no idea what I’m paying for. I can’t accurately budget for IT costs. I can do better getting IT services myself.

The problem is that end-user departments and organizations can sometimes see IT operations as just a black box. In recent years, IT chargeback systems have attracted more interest as a way to address all those concerns and rising energy use and costs. In fact, IT chargeback can be a cornerstone of practical, enterprise-wide efficiency efforts.

IT chargeback is a method of charging internal consumers (e.g., departments, functional units) for the IT services they used. Instead of bundling all IT costs under the IT department, a chargeback program allocates the various costs of delivering IT (e.g., services, hardware, software, maintenance) to the business units that consume them.

Many organizations already use some form of IT chargeback, but many don’t, instead treating IT as corporate overhead. Resistance to IT chargeback often comes from the perception that it requires too much effort. It’s true that time, administrative cost, and organizational maturity is needed to implement chargeback.

However, the increased adoption of private and public cloud computing is causing organizations to re-evaluate and reconsider IT chargeback methods. Cloud computing has led some enterprises to ask their IT organizations to explain their internal costs. Cloud options can shave a substantial amount from IT budgets, which pressures IT organizations to improve cost modeling to either fend off or justify a cloud transition. In some cases, IT is now viewed as more of a commodity—with market competition. In these circumstances, accountability and efficiency improvements can bring significant cost savings that make chargeback a more attractive path.

CHARGEBACK vs. UNATTRIBUTED ACCOUNTING
All costs are centralized in traditional IT accounting. One central department pays for all IT equipment and activities, typically out of the CTO or CIO’s budget, and these costs are treated as corporate overhead shared evenly by multiple departments. In an IT chargeback accounting model, individual cost centers are charged for their IT service based on use and activity. As a result, all IT costs are “zeroed out” because they have all been assigned to user groups. IT is no longer considered overhead, instead it can be viewed as part of each department’s business and operating expenses (OpEx).

With the adoption of IT chargeback, an organization can expect to see significant shifts in awareness, culture, and accountability, including:

• Increased transparency due to accurate allocation of IT costs and usage. Chargeback allows consumers to see their costs and understand how those costs are determined.

• Improved IT financial management, as groups become more aware of the cost of their IT usage and business choices. With chargeback, consumers become more interested and invested in the costs of delivering IT as a service.

• Increased awareness of how IT contributes to the business of the organization. IT is not just overhead but is seen as providing real business value.

• Responsibility for controlling IT costs shifts to business units, which become  accountable for their own use.

• Alignment of IT operations and expenditures with the business. IT is no longer just an island of overhead costs but becomes integrated into business planning, strategy, and operations.

The benefits of an IT chargeback model included simplified IT investment decision making, reduced resource consumption, improved relationships between business units and IT, and greater perception of IT value. Holding departments accountable leads them to modify their behaviors and improve efficiency. For example, chargeback tends to reduce overall resource consumption as business units stop hoarding surplus servers or other resources to avoid the cost of maintaining these underutilized assets. At the same time, organizations experience increased internal customer satisfaction as IT and the business units become more closely aligned and begin working together to analyze and improve efficiency.

Perhaps most importantly, IT chargeback drives cost control. As users become aware of the direct costs of their activities, they become more willing to improve their utilization, optimize their software and activities, and analyze cost data to make better spending decisions. This can extend the life of existing resources and infrastructure, defer resource upgrades, and identify underutilized resources that can be deployed more efficiently. Just as we have seen in organizations that adopt a server decommissioning program (such as the successful initiatives of Uptime Institute’s Server Roundup) (https://uptimeinstitute.com/training-events/server-roundup), IT chargeback identifies underutilized assets that can be reassigned or decommissioned. As a result, more space and power becomes available to other equipment and services, thus extending the life of existing infrastructure. An organization doesn’t have to build new infrastructure if it can get more from current equipment and systems.

IT chargeback also allows organizations to make fully informed decisions about outsourcing. Chargeback provides useful metrics that can be compared against cloud providers and other outsource IT options. As IT organizations are being driven to emulate cloud provider services, a chargeback applies free-market principles to IT (with appropriate governance and controls). The IT group becomes more akin to a service provider, tracking and reporting the same metrics on a more apples-to-apples basis.

Showback is closely related to chargeback and offers many of the same advantages without some of the drawbacks. This strategy employs the same approach as chargeback, with tracking and cost-center allocation of IT expenses. Showback measures and displays the IT cost breakdown by consumer unit just as chargeback does, but without actually transferring costs back. Costs remain in the IT group, but information is still transparent about consumer utilization. Showback can be easy to implement since there is no immediate budgetary impact on user groups.

The premise behind showback and chargeback is the same: awareness drives accountability. However, since business units know they will not be charged in a showback system, their attention to efficiency and improving utilization may not be as focused. Many organizations have found that starting with a showback approach for an initial 3-6 months is an effective way to introduce chargeback, testing the methodology and metrics and allowing consumer groups to get used to the approach before full implementation of chargeback accountability.

The stakeholders affected by chargeback/showback include:

• Consumers: Business units that consume IT resources, e.g., organizational entities, departments,  applications, and end users.

• Internal service providers: Groups responsible for providing IT services, e.g., data center teams, network  teams, and storage.

• Project sponsor: The group funding the effort and ultimately responsible for its success. Often this is someone under the CTO or can also be a finance/accounting leader.

• Executive team: The C-suite individuals responsible for setting chargeback as an organizational priority and ensuring enterprise-wide participation to bring it to fruition.

• Administrator: The group responsible for operating the chargeback program (e.g., IT finance and accounting).

CHARGEBACK METHODS
A range of approaches have been developed for implementing chargeback in an organization, as summarized in Figure 1. The degree of complexity, degree of difficulty, and cost to implement decreases from the top of the chart [service-based pricing (SBP)], to the bottom [high-level allocation (HLA)]. HLA is the simplest method; it uses a straight division of IT costs based on a generic metric such as headcount. Slightly more effort to implement is low-level allocation (LLA), which bases consumer costs on something more related to IT activity such as the number of users or servers. Direct cost (DC) more closely resembles a time and materials charge but is often tied to headcount as well.

Figure 1. Methods for chargeback allocation.

Figure 1. Methods for chargeback allocation.

Measured resource usage (MRU) focuses on the amount of actual resource usage of each department, using metrics such as power (in kilowatts), network bandwidth and terabytes of storage. Tiered flat rate (TFR), negotiated flat rate (NFR), and service based pricing (SBP) are all increasingly sophisticated applications of measuring actual usage by service.

THE CHARGEBACK SWEET SPOT
Measured resource usage (MRU) is often the sweet spot for chargeback implementation. It makes use of readily available data that are likely already known or collected. For example, data center teams typically measure power consumption at the server level, and storage groups know how many terabytes are being used by different users/departments. MRU is a straight allocation of IT costs, thus it is fairly intuitive for consumer organizations to accept. It is not quite as simple as other methods to implement but does provide fairness and is easily controllable.

MRU treats IT services as a utility, consumed and reserved based on key activities:

• Data center = power

• Network = bandwidth

• Storage = bytes

• Cloud =virtual machines or other metric

• Network Operations Center = ticket count or total time to resolve per customer

PREPARING FOR CHARGEBACK IMPLEMENTATION
If an organization is to successfully implement chargeback, it must choose the method that best fits its objectives and apply the method with rigor and consistency. Executive buy-in is critical. Without top-down leadership, chargeback initiatives often fail to take hold. It is human nature to resist accountability and extra effort, so leadership is needed to ensure that chargeback becomes an integral part of the business operations.

To start, it’s important that an organization know the infrastructure capital expense (CapEx) and OpEx costs. Measuring, tracking, reporting, and questioning these costs, and acting on the information to base investment and operating decisions on real costs is critical to becoming an efficient IT organization. To understand CapEx costs, organizations should consider the following:

• Facility construction or acquisition

• Power and cooling infrastructure equipment: new, replacement, or upgrades

• IT hardware: server, network, and storage hardware

• Software licenses, including operating system and application software

• Racks, cables: initial costs (i.e., items installed in the initial set up of the data room)

OpEx incorporates all the ongoing costs of running an IT facility. They are ultimately larger than CapEx in the long run, and include:

• FTE/payroll

• Utility expenses

• Critical facility maintenance (e.g., critical power and cooling, fire and life safety, fuel systems)

• Housekeeping and grounds (e.g., cleaning, landscaping, snow removal)

• Disposal/recycling

• Lease expenses

• Hardware maintenance

• Other facility fees such as insurance, legal, and accounting fees

• Office charges (e.g., telephones, PCs, office supplies)

• Depreciation of facility assets

• General building maintenance (e.g., office area, roof, plumbing)

• Network expenses (in some circumstances)

The first three items (FTE/payroll, utilities, and critical facility maintenance) typically make up the largest portion of these costs. For example, utilities can account for a significant portion of the IT budget. If IT is operated in a colocation environment, the biggest costs could be lease expenses. The charges from a colocation provider typically will include all the other costs, often negotiated. For enterprise-owned data centers, all these OpEx categories can fluctuate monthly depending on activities, seasonality, maintenance schedules, etc. Organizations can still budget and plan for OpEx effectively, but it takes an awareness of fluctuations and expense patterns.

At a fundamental level, the goal is to identify resource consumption by consumer, for example the actual kilowatts per department. More sophisticated resource metrics might include the cost of hardware installation (moves, adds, changes) or the cost per maintenance ticket. For example, in the healthcare industry, applications for managing patient medical data are typically large and energy intensive. If 50% of a facility’s servers are used for managing patient medical data, the company could determine the kilowatt per server and multiply total OpEx by the percentage of total IT critical power used for this activity as a way to allocate costs. If 50% of its servers are only using 30% of the total IT critical load, then it could use 30% to determine the allocation of data center operating costs. The closer the data can get to representing actual IT usage, the better.

An organization that can compile this type of data for about 95% of its IT costs will usually find it sufficient for implementing a very effective chargeback program. It isn’t necessary for every dollar to be accounted for. Expense allocations will be closely proportional based on actual consumption of kilowatts and/or bandwidth consumed and reserved by each user organization. Excess resources typically are absorbed proportionally by all. Even IT staff costs can be allocated by tracking and charging their activity to different customers using timesheets or by headcount where staff is dedicated to specific customers.

Another step in preparing an organization to adopt an IT chargeback methodology is defining service levels. What’s key is setting expectations appropriately so that end users, just like customers, know what they are getting for what they are paying. Defining uptime (e.g., Tier level such as Tier III Concurrent Maintainability or Tier IV Fault Tolerant infrastructure or other uptime and/or downtime requirements, if any), and outlining a detailed service catalog are important.

IT CHARGEBACK DRIVES EFFICIENT IT
Adopting an IT chargeback model may sound daunting, and doing so does take some organizational commitment and resources, but the results are worthwhile. Organizations that have implemented IT chargeback have experienced reductions in resource consumption due to increased customer accountability, and higher, more efficient utilization of hardware, space, power, and cooling due to reduction in servers. IT chargeback brings a new, enterprise-wide focus on lowering data center infrastructure costs with diverse teams working together from the same transparent data to achieve common goals, now possible because everyone has “skin in the game.”

Essentially, achieving efficient IT outcomes demands a “follow the money” mindset. IT chargeback drives a holistic approach in which optimizing data center and IT resource consumption becomes the norm. A chargeback model also helps to propel organizational maturity, as it drives the need for more automation and integrated monitoring, for example the use of a DCIM system. To collect data and track resources and key performance indicators manually is too tedious and time consuming, so stakeholders have an incentive to improve automated tracking, which ultimately improves overall business performance and effectiveness.

IT chargeback is more than just an accounting methodology; it helps drive the process of optimizing business operations and efficiency, improving competitiveness and adding real value to support the enterprise mission.


IT CHARGEBACK DOs AND DON’Ts

18959533301_e9873c4aa4_o

19 May 2015, Uptime Institute gathered a group of senior stakeholders for the Executive Assembly for Efficient IT. The group was composed of leaders from large financial, healthcare, retail and Web-scale IT organizations and the purpose of the meeting was to share experiences, success stories and challenges to improving IT efficiency.

At Uptime Institute’s 2015 Symposium, executives from leading data center organizations that have implemented IT chargeback discussed the positive results they had achieved. They also shared the following recommendations for companies considering adopting an IT chargeback methodology.

DO:
• Partner with the Finance department. Finance has to completely buy in to implementing chargeback.

• Inventory assets and determine who is using them. A complete inventory of the number of data centers, number of servers, etc., is needed to develop a clear picture of what is being used.

• Chargeback needs strong senior-level support; it will not succeed as a bottom-up initiative. Similarly don’t try to implement it from the field. Insist that C-suite representatives (COO/CFO) visit the data center so the C-suite understands the concept and requirements.

• Focus on cash management as the goal, not finance issues (e.g., depreciation) or IT equipment (e.g., server models and UPS equipment specifications). Know the audience, and get everyone on the same page talking about straight dollars and cents.

• Don’t give teams too much budget—ratchet it down. Make departments have to make trade-offs so they begin to make smarter decisions.

• Build a dedicated team to develop the chargeback model. Then show people the steps and help them understand the decision process.

• Data is critical: show all the data, including data from the configuration management data base (CMDB), in monthly discussions.

• Be transparent to show and add credibility. For example, explain clearly, “Here’s where we are and here’s where we are trying to get to.”

• Above all, communicate. People will need time to get used to the idea.

DON’TS:
• Don’t try to drive chargeback from the bottom up.

• Simpler is better: don’t overcomplicate the model. Simplify the rules and prioritize; don’t get hung up perfecting every detail because it doesn’t save much money. Approximations can be sufficient.

• Don’t move too quickly: start with showback. Test it out first; then, move to chargeback.

• To get a real return, get rid of the old hardware. Move quickly to remove old hardware when new items are purchased. The efficiency gains are worth it.

• The most challenging roadblocks can turn out to be the business units themselves. Organizational changes might need to go the second level within the business unit if it has functions and layers under them that should be separate.


Scott Killian

Scott Killian

Scott Killian joined the Uptime Institute in 2014 and currently serves as VP for Efficient IT Program. He surveys the industry for current practices and develops new products to facilitate industry adoption of best practices. Mr. Killian directly delivers consulting at the site management, reporting, and governance levels. He is based in Virginia.

Prior to joining Uptime Institute, Mr. Killian led AOL’s holistic resource consumption initiative, which resulted in AOL winning two Uptime Institute Server Roundups for decommissioning more than 18,000 servers and reducing operating expenses more than US$6 million. In addition, AOL received three awards in the Green Enterprise IT (GEIT) program. AOL accomplished all this in the context of a five-year plan developed by Mr. Killian to optimize data center resources, which saved US$17 million annually.

The post IT Chargeback Drives Efficiency appeared first on Uptime Institute eJournal.

Examining and Learning from Complex Systems Failures

$
0
0

Conventional wisdom blames “human error” for the majority of outages, but those failures are incorrectly attributed to front-line operator errors, rather than management mistakes

By Julian Kudritzki, with Anne Corning

Data centers, oil rigs, ships, power plants, and airplanes may seem like vastly different entities, but all are large and complex systems that can be subject to failure‹sometimes catastrophic failure. Natural events like earthquakes or storms may initiate a complex system failure. But often blame is assigned to “human error”‹ front-line operator mistakes, which combine with a lack of appropriate procedures and resources or compromised structures that result from poor management decisions.

“Human error” is an insufficient and misleading term. The front-line operator’s presence at the site of the incident ascribes responsibility to the operator for failure to rescue the situation. But this masks the underlying causes of an incident. It is more helpful to consider the site of the incident as a spectacle of mismanagement.

Responsibility for an incident, in most cases, can be attributed to a senior management decision (e.g., design compromises, budget cuts, staff reductions, vendor selecting and resourcing) seemingly disconnected in time and space from the site of the incident. What decisions led to a situation where front line operators were unprepared or untrained to respond to an incident and mishandled it?

To safeguard against failures, standards and practices have evolved in many industries that encompass strict criteria and requirements for the design and operation of systems, often including inspection regimens and certifications. Compiled, codified, and enforced by agencies and entities in the transportation industry, these programs and requirements help protect the service user from the bodily injuries or financial effects of failures and spur industries to maintain preparedness and best practices.

Twenty years of Uptime Institute research into the causes of data center incidents places predominant accountability for failures at the management level and finds only single-digit percentages of spontaneous equipment failure.

This fundamental and permanent truth compelled the Uptime Institute to step further into standards and certifications that were unique to the data center and IT industry. Uptime Institute undertook a collaborative approach with a variety of stakeholders to develop outcome-based criteria that would be lasting and developed by and for the industry. Uptime Institute¹s Certifications were conceived to evaluate, in an unbiased fashion, front-line operations within the context of management structure and organizational behaviors.

EXAMINING FAILURES
The sinking of the Titanic. The Deepwater Horizon oil spill. DC-10 air crashes in the 1970s. The failure of  New Orleans’ levee system. The Three Mile Island nuclear release. The northeast (U.S.) blackout of 2003. Battery fires in Boeing 787s. The space shuttle Challenger disaster. Fukushima Daiichi nuclear disaster. The grounding of the Kulluk arctic drilling rig. These are a few of the most infamous, and in some cases tragic, engineering system failures in history. While the examples come from vastly different industries and each story unfolded in its own unique way, they all have something in common with each other‹and with data centers. All exemplify highly complex systems operating in technologically sophisticated industries.

The hallmarks of so-called complex systems are “a large number of interacting components, emergent properties difficult to anticipate from the knowledge of single components, adaptability to absorb random disruptions, and highly vulnerable to widespread failure under adverse conditions (Dueñas-Osorio and Vemuru 2009).” Additionally, the components of complex systems typically interact in non-linear fashion, operating in large interconnected networks.

Large systems and the industries that use them have many safeguards against failure and multiple layers of protection and backup. Thus, when they fail it is due to much more than a single element or mistake.

It is a truism that complex systems tend to fail in complex ways. Looking at just a few examples from various industries, again and again we see that it was not a single factor but the compound effect of multiple factors that disrupted these sophisticated systems. Often referred to as “cascading failures,” complex system breakdowns usually begin when one component or element of the system fails, requiring nearby “nodes” (or other components in the system network) to take up the workload or service obligation of the failed component. If this increased load is too great, it can cause other nodes to overload and fail as well, creating a waterfall effect as every component failure increases the load on the other, already stressed components. The following transferable concept is drawn from the power industry:

Power transmission systems are heterogeneous networks of large numbers of components that interact in diverse ways. When component operating limits are exceeded, protection acts to disconnect the component and the component Œ”fails” in the sense of not being available… Components can also fail in the sense of misoperation or damage due to aging, fire, weather, poor maintenance, or incorrect design or operating settings…. The effects of the component failure can be local or can involve components far away, so that the loading of many other components throughout the network is increased… the flows all over the network change (Dobson, et al. 2009).

A component of the network can be mechanical, structural or human agent, as front-line operators respond to an emerging crisis. Just as engineering components can fail when overloaded, so can human effectiveness and decision-making capacity diminish under duress. A defining characteristic of a high risk organization is that it provides structure and guidance despite extenuating circumstances‹duress is its standard operating condition.

The sinking of the Titanic is perhaps the most well-known complex system failure in history. This disaster was caused by the compound effect of structural issues, management decisions, and operating mistakes that led to the tragic loss of 1,495 lives. Just a few of the critical contributing factors include design compromises (e.g., reducing the height of the watertight bulkheads that allowed water to flow over the tops and limiting the number of lifeboats for aesthetic considerations), poor discretionary decisions (e.g., sailing at excessive speed on a moonless night despite reports of icebergs ahead), operator error (e.g., the lookout in the crow¹s nest had no binoculars‹a cabinet key had been left behind in Southampton), and misjudgment in the crisis response (e.g., the pilot tried to reverse thrust when the iceberg was spotted, instead of continuing at full speed and using the momentum of the ship to turn course and reduce impact). And, of course, there was the hubris of believing the ship was unsinkable.

Figure 1a. (Left) NTSB photo of the burned auxiliary power unit battery from a JAL Boeing 787 that caught fire on January 7, 2013 at Boston¹s Logan International Airport. Photo credit: By National Transportation Safety Board (NTSB) [Public domain], via Wikimedia Commons. Figure 1b. (Right) A side-by-side comparison of an original Boeing Dreamliner (787) battery compared and a damaged Japan Air Lines battery. Photo credit: By National Transportation Safety Board (NTSB) [Public domain], via Wikimedia Commons.

Figure 1a. (Left) NTSB photo of the burned auxiliary power unit battery from a JAL Boeing 787 that caught fire on January 7, 2013 at Boston¹s Logan International Airport. Photo credit: By National Transportation Safety Board (NTSB) [Public domain], via Wikimedia Commons. Figure 1b. (Right) A side-by-side comparison of an original Boeing Dreamliner (787) battery compared and a damaged Japan Air Lines battery. Photo credit: By National Transportation Safety Board (NTSB) [Public domain], via Wikimedia Commons.


Looking at a more recent example, the issue of battery fires in Japan Airlines (JAL) Boeing 787s, which came to light in 2013 (see Figure 1), was ultimately blamed on a combination of design, engineering, and process management shortfalls (Gallagher 2014). Following its investigation, the U.S. National Transportation Safety Board reported (NTSB 2014):

•   Manufacturer errors in design and quality control. The manufacturer failed to adequately account for the thermal runaway phenomenon: an initial overheating of the batteries triggered a chemical reaction that generated more heat, thus causing the batteries to explode or catch fire. Battery “manufacturing defects and lack of oversight in the cell manufacturing process” resulted in the development of lithium mineral deposits in the batteries. Called lithium dendrites, these deposits can cause a short circuit that reacts chemically with the battery cell, creating heat. Lithium dendrites occurred in wrinkles that were found in some of the battery electrolyte material, a manufacturing quality control issue.

•   Shortfall in certification processes. The NTSB found shortcomings in U.S.  Federal Aviation Administration  (FAA) guidance and certification processes. Some important factors were overlooked that should have been considered during safety assessment of the batteries.

•   Lack of contractor oversight and proper change orders. A cadre of contractors and subcontractors were  involved in the manufacture of the 787’s electrical systems and battery components. Certain entities made changes to the specifications and instructions without proper approval or oversight. When the FAA performed an audit, it found that Boeing’s prime contractor wasn’t following battery component assembly and installation instructions and was mislabeling parts. A lack of “adherence to written procedures and communications” was cited.

How many of these circumstances parallel those that can happen during the construction and operation of a data center? It is all too common to find deviations from as-designed systems during the construction process, inconsistent quality control oversight, and the use of multiple subcontractors. Insourced and outsourced resources may disregard or hurry past written procedures, documentation, and communication protocols (search Avoiding Data Center Construction Problems @ journal.uptimeinstitute.com).

THE NATURE OF COMPLEX SYSTEM FAILURES
Large industrial and engineered systems are risky by their very nature. The greater the number of components and the higher the energy and heat levels, velocity, and size and weight of these components the greater the skill and teamwork required to plan, manage, and operate the systems safely. Between mechanical components and human actions, there are thousands of possible points where an error can occur and potentially trigger a chain of failures.

In his seminal article on the topic of complex system failure How Complex Systems Fail, ‹first published in 1998 and still widely referenced today, ‹Dr. Richard I. Cook identifies and discusses 18 core elements of failure in complex systems:
1. Complex systems are intrinsically hazardous systems.
2. Complex systems are heavily and successfully defended against failure.
3. Catastrophe requires multiple failures‹single point failures are not enough.
4. Complex systems contain changing mixtures of failures latent within them.
5. Complex systems run in degraded mode.
6. Catastrophe is always just around the corner.
7. Post-accident attribution to a Œroot cause is fundamentally wrong.
8. Hindsight biases post-accident assessments of human performance.
9. Human operators have dual roles: as producers and as defenders against failure.
10. All practitioner actions are gambles.
11. Actions at the sharp end resolve all ambiguity.
12. Human practitioners are the adaptable element of complex systems.
13. Human expertise in complex systems is constantly changing.
14. Change introduces new forms of failure.
15. Views of Œcause limit the effectiveness of defenses against future events.
16. Safety is a characteristic of systems and not of their components.
17. People continuously create safety.
18. Failure-free operations require experience with failure (Cook 1998).

Let’s examine some of these principles in the context of a data center. Certainly high-voltage electrical systems, large-scale mechanical and infrastructure components, high-pressure water piping, power generators, and other elements create hazards [Element 1] for both humans and mechanical systems/structures. Data center systems are defended from failure by a broad range of measures [Element 2], both technical (e.g., redundancy, alarms, and safety features of equipment) and human (e.g., knowledge, training, and procedures). Because of these multiple layers of protection, a catastrophic failure would require the breakdown of multiple systems or multiple individual points of failure [Element 3].

RUNNING NEAR CRITICAL FAILURE
Complex systems science suggests that most large-scale complex systems, even well-run ones, by their very nature are operating in “degraded mode” [Element 5], i.e., close to the critical failure point. This is due to the progression over time of various factors including steadily increasing load demand, engineering forces, and economic factors.

The enormous investments in data center and other highly available infrastructure systems perversely incents conditions of elevated risk and higher likelihood of failure. Maximizing capacity, increasing density, and hastening production from installed infrastructure improves the return on investment (ROI) on these major capital investments. Deferred maintenance, whether due to lack of budget or hands-off periods due to heightened production, further pushes equipment towards performance limits‹the breaking point.

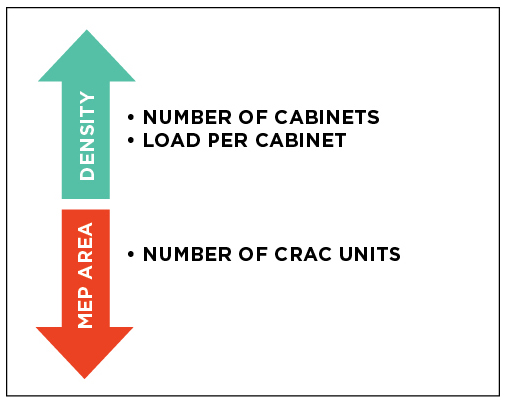
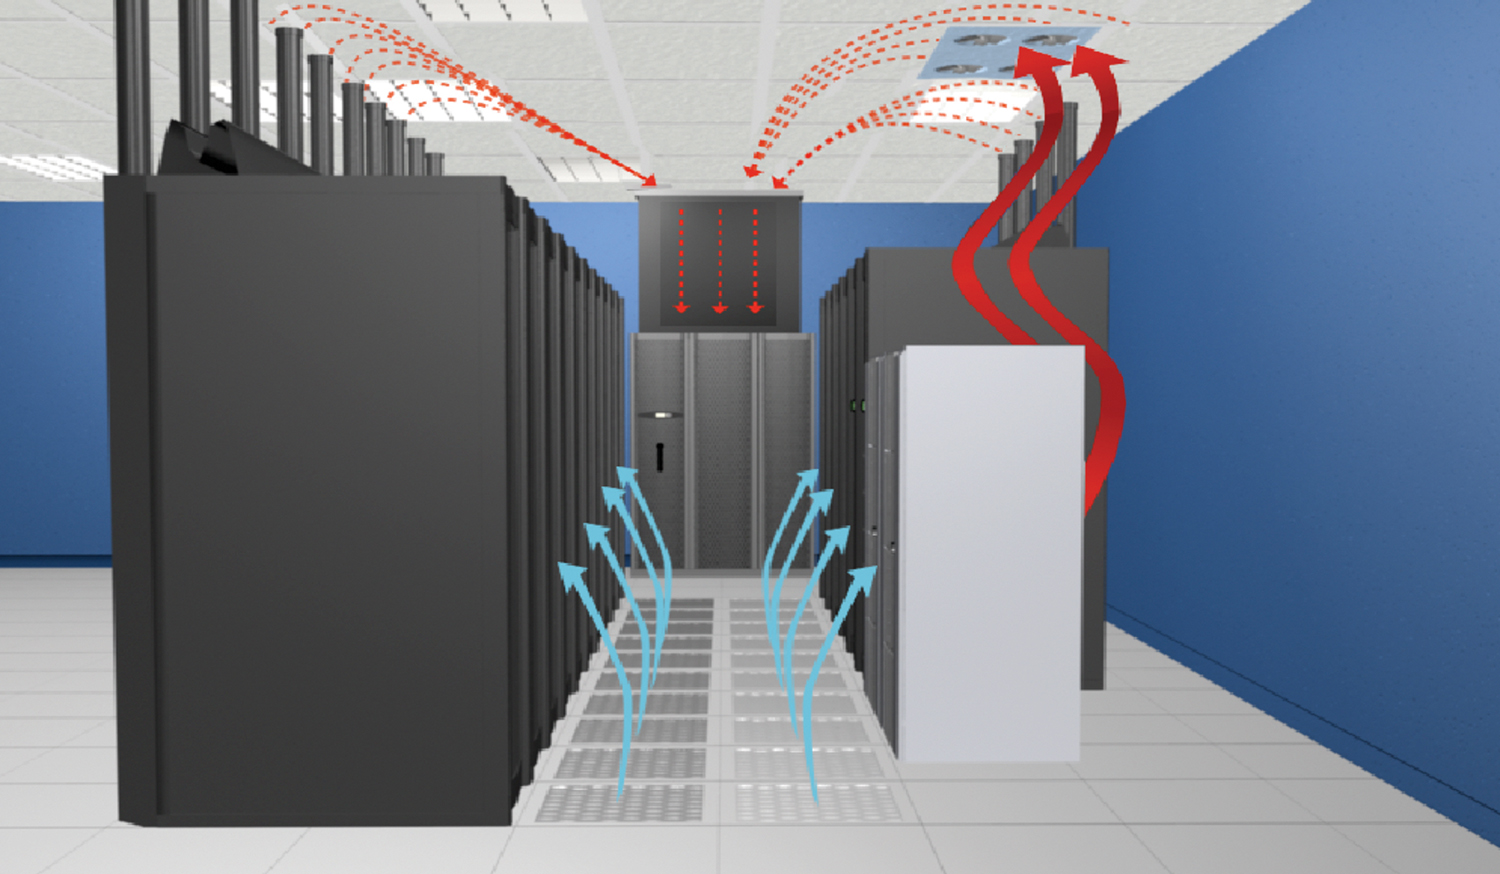
The increasing density of data center infrastructure exemplifies the dynamics that continually and inexorably push a system towards critical failure. Server density is driven by a mixture of engineering forces (advancements in server design and efficiency) and economic pressures (demand for more processing capacity without increasing facility footprint). Increased density then necessitates corresponding increases in the number of critical heating and cooling elements. Now the system is running at higher risk, with more components (each of which is subject to individual fault/failure), more power flowing through the facility, more heat generated, etc.

This development trajectory demonstrates just a few of the powerful “self-organizing” forces in any complex system. According to Dobson, et al (2009), “these forces drive the system to a dynamic equilibrium that keeps [it] near a certain pattern of operating margins relative to the load. Note that engineering improvements and load growth are driven by strong, underlying economic and societal forces that are not easily modified.”

Because of this dynamic mix of forces, the potential for a catastrophic outcome is inherent in the very nature of complex systems [Element 6]. For large-scale mission critical and business critical systems, the profound implication is that designers, system planners, and operators must acknowledge the potential for failure and build in safeguards.

WHY IS IT SO EASY TO BLAME HUMAN ERROR?
Human error is often cited as the root cause of many engineering system failures, yet it does not often cause a major disaster on its own. Based on analysis of 20 years of data center incidents, Uptime Institute holds that human error must signify management failure to drive change and improvement. Leadership decisions and priorities that result in a lack of adequate staffing and training, an organizational culture that becomes dominated by a fire drill mentality, or budget cutting that reduces preventive/proactive maintenance could result in cascading failures that truly flow from the top down.

Although front-line operator error may sometimes appear to cause an incident, a single mistake (just like a single data center component failure) is not often sufficient to bring down a large and robust complex system unless conditions are such that the system is already teetering on the edge of critical failure and has multiple underlying risk factors. For example, media reports after the 1983 Exxon Valdez oil spill zeroed in on the fact that the captain, Joseph Hazelwood, was not at the bridge at the time of the accident and accused him of drinking heavily that night. However, more measured assessments of the accident by the NTSB and others found that Exxon had consistently failed to supervise the captain or provide sufficient crew for necessary rest breaks (see Figure 2).

Figure 2. Shortly after leaving the Port of Valdez, the Exxon Valdez ran aground on Bligh Reef. The picture was taken three days after the vessel grounded, just before a storm arrived. Photo credit: Office of Response and Restoration, National Ocean Service, National Oceanic and Atmospheric Administration [Public domain], via Wikimedia Commons.

Figure 2. Shortly after leaving the Port of Valdez, the Exxon Valdez ran aground on Bligh Reef. The picture was taken three days after the vessel grounded, just before a storm arrived. Photo credit: Office of Response and Restoration, National Ocean Service, National Oceanic and Atmospheric Administration [Public domain], via Wikimedia Commons.


Perhaps even more critical was the lack of essential navigation systems: the tanker’s radar was not operational at time of the accident. Reports indicate that Exxon’s management had allowed the RAYCAS radar system to stay broken for an entire year before the vessel ran aground because it was expensive to operate. There was also inadequate disaster preparedness and an insufficient quantity of oil spill containment equipment in the region, despite the experiences of previous small oil spills. Four years before the accident, a letter written by Captain James Woodle, who at that time was the Exxon oil group¹s Valdez port commander, warned upper management, “Due to a reduction in manning, age of equipment, limited training and lack of personnel, serious doubt exists that [we] would be able to contain and clean-up effectively a medium or large size oil spill” (Palast 1999).

As Dr. Cook points out, post-accident attribution to a root cause is fundamentally wrong [Element 7]. Complete failure requires multiple faults, thus attribution of blame to a single isolated element is myopic and, arguably, scapegoating. Exxon blamed Captain Hazelwood for the accident, and his share of the blame obscures the underlying mismanagement that led to the failure. Inadequate enforcement by the U.S. Coast Guard and other regulatory agencies further contributed to the disaster.

Similarly, the grounding of the oil rig Kulluk was the direct result of a cascade of discrete failures, errors, and mishaps, but the disaster was first set in motion by Royal Dutch Shell’s executive decision to move the rig off of the Alaskan coastline to avoid tax liability, despite high risks (Lavelle 2014). As a result, the rig and its tow vessels undertook a challenging 1,700-nautical-mile journey across the icy and storm-tossed waters of the Gulf of Alaska in December 2012 (Funk 2014).

There had already been a chain of engineering and inspection compromises and shortfalls surrounding the Kulluk, including the installation of used and uncertified tow shackles, a rushed refurbishment of the tow vessel Discovery, and electrical system issues with the other tow vessel, the Aivik, which had not been reported to the Coast Guard as required. (Discovery experienced an exhaust system explosion and other mechanical issues in the following months. Ultimately the tow company‹a contractor‹was charged with a felony for multiple violations.)

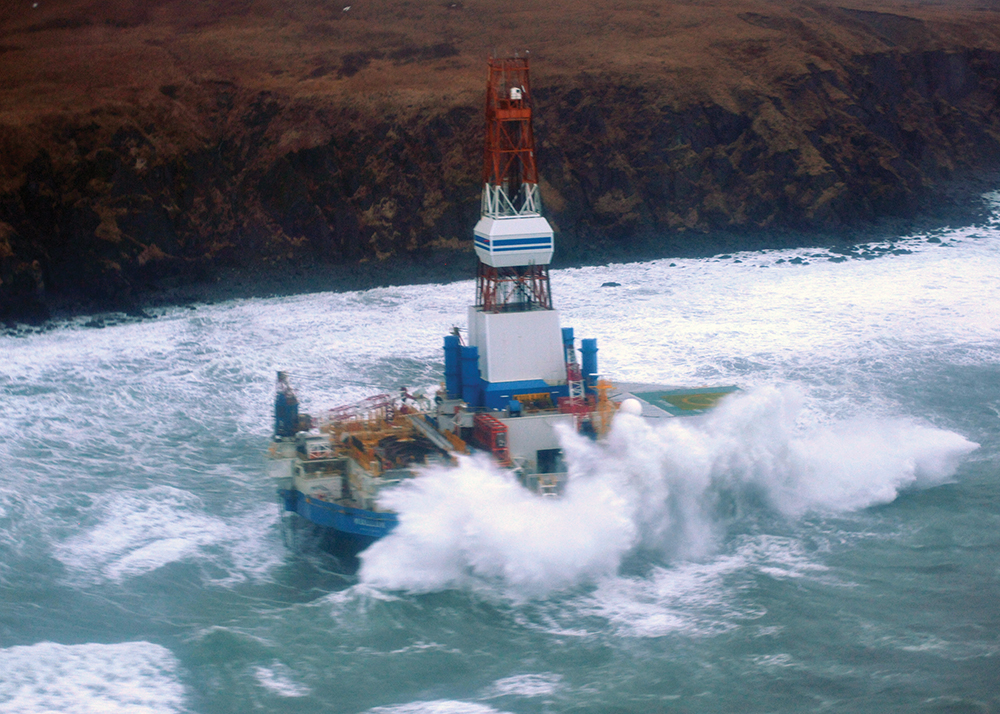
This journey would be the Kulluk’s last, and it included a series of additional mistakes and mishaps. Gale-force winds put continual stress on the tow line and winches. The tow ship was captained on this trip by an inexperienced replacement, who seemingly mistook tow line tensile alarms (set to go off when tension exceeded 300 tons) for another alarm that was known to be falsely annunciating. At one point the Aivik, in attempting to circle back and attach a new tow line, was swamped by a wave, sending water into the fuel pumps (a problem that had previously been identified but not addressed), which caused the engines to begin to fail over the next several hours (see Figure 3). Waves crash over the mobile offshore drilling unit Kulluk where it sits aground on the southeast side of Sitkalidak Island, Alaska, Jan. 1, 2013. A Unified Command, consisting of the Coast Guard, federal, state, local and tribal partners and industry representatives was established in response to the grounding. U.S. Coast Guard photo by Petty Officer 3rd Class Jonathan Klingenberg.

Waves crash over the mobile offshore drilling unit Kulluk where it sits aground on the southeast side of Sitkalidak Island, Alaska, Jan. 1, 2013. A Unified Command, consisting of the Coast Guard, federal, state, local and tribal partners and industry representatives was established in response to the grounding. U.S. Coast Guard photo by Petty Officer 3rd Class Jonathan Klingenberg.

Despite harrowing conditions, Coast Guard helicopters were eventually able to rescue the 18 crew members aboard the Kulluk. Valiant last-ditch tow attempts were made by the (repaired) Aivik and Coast Guard tugboat Alert, before the effort had to be abandoned and the oil rig was pushed aground by winds and currents.

Poor management decision making, lack of adherence to proper procedures and safety requirements, taking shortcuts in the repair of critical mechanical equipment, insufficient contractor oversight, lack of personnel training/experience­ all of these elements of complex system failure are readily seen as contributing factors in the Kulluk disaster.


EXAMINING DATA CENTER SYSTEM FAILURES
Two recent incidents demonstrate how the dynamics of complex systems failures can quickly play out in the data center environment.

Example A
Tier III Concurrent Maintenance data center criteria (see Uptime Institute Tier Standard: Topology) require multiple, diverse independent distribution paths serving all critical equipment to allow maintenance activity without impacting critical load. The data center in this example had been designed appropriately with fuel pumps and engine- generator controls powered from multiple circuit panels. As built, however, a single panel powered both, whether due to implementation oversight or cost reduction measures. At issue is not the installer, but rather the quality of communications from the implementation team and the operations team.

In the course of operations, technicians had to shut off utility power during the performance of routine maintenance to an electrical switchgear. This meant the building was running on engine-generator sets. However, when the engine-generator sets started to surge due to a clogged fuel line. The UPS automatically switched the facility to battery power. The day tanks for the engine-generator sets were starting to run dry. If quick-thinking operators had not discovered the fuel pump issue in time, there would have been an outage to the entire facility: a cascade of events leading down a rapid pathway from simple routine maintenance activity to complete system failure.

Example B
Tier IV Fault Tolerant data center criteria require the ability to detect and isolate a fault while maintaining capacity to handle critical load. In this example, a Tier IV enterprise data center shared space with corporate offices in the same building, with a single chilled water plant used to cool both sides of the building. The office air handling units also brought in outside air to reduce cooling costs.

One night, the site experienced particularly cold temperatures and the control system did not switch from outside air to chilled water for office building cooling, which affected data center cooling as well. The freeze stat (a temperature sensing device that monitors a heat exchanger to prevent its coils from freezing) failed to trip; thus the temperature continued to drop and the cooling coil froze and burst, leaking chilled water onto the floor of the data center. There was a limited leak detection system in place and connected, but it had not been fully tested yet. Chilled water continued to leak until pressure dropped and then the chilled water machines started to spin offline in response. Once the chilled water machines went offline neither the office building nor data center had active cooling.

At this point, despite the extreme outside cold, temperatures in the data hall rose through the night. As a result of the elevated indoor temperature conditions, the facility experienced myriad device-level (e.g., servers, disc drives, and fans) failures over the following several weeks. Though a critical shut down was not the issue, damage to components and systems‹and the cost of cleanup and replacement parts and labor‹were significant. One single initiating factor‹a cold night‹combined with other elements in a cascade of failures.

In both of these cases, severe disaster was averted, but relying on front-line operators to save the situation is neither robust not reliable.


PREVENTING FAILURES IN THE DATA CENTER
Organizations that adhere to the principles of Concurrent Maintainability and/or Fault Tolerance, as outlined in Tier Standard: Topology, take a vital first step toward reducing the risk of a data center failure or outage.

However, facility infrastructure is only one component of failure prevention; how a facility is run and operated on a day-to-day basis is equally critical. As Dr. Cook noted, humans have a dual role in complex systems as both the potential producers (causes) of failure as well as, simultaneously, some of the best defenders against failure [Element 9].

The fingerprints of human error can be seen on the two data center examples. In Example A, the electrical panel was not set up as originally designed, and the leak detection system, which could have alerted operators to the problem, had not been fully activated in Example B.

Dr. Cook also points out that human operators are the most adaptable component of complex systems [Element 12], as they “actively adapt the system to maximize production and minimize accidents.” For example, operators may “restructure the system to reduce exposure of vulnerable parts,” reorganize critical resources to focus on areas of high demand, provide “pathways for retreat or recovery,” and “establish means for early detection of changed system performance in order to allow graceful cutbacks in production or other means of increasing resiliency.” Given the highly dynamic nature of complex system environments, this human-driven adaptability is key.

STANDARDIZATION CAN ADDRESS MANAGEMENT SHORTFALLS
In most of the notable failures in recent decades, there was a breakdown or circumvention of established standards and certifications. It was not a lack of standards, but a lack of compliance or sloppiness that contributed the most to the disastrous outcomes. For example, in the case of the Boeing batteries, the causes were bad design, poor quality inspections, and lack of contractor oversight. In the case of the Exxon Valdez, inoperable navigation systems and inadequate crew manpower and oversight‹along with insufficient disaster preparedness‹were critical factors. If leadership, operators, and oversight agencies had adhered to their own policies and requirements and had not cut corners for economics or expediency, these disasters might have been avoided.

Ongoing operating and management practices and adherence to recognized standards and requirements, therefore, must be the focus of long-term risk mitigation. In fact, Dr. Cook states that “failure-free operations are the result of activities of people who work to keep the system within the boundaries of tolerable performance…. human practitioner adaptations to changing conditions actually create safety from moment to moment” [Element 17]. This emphasis on human activities as decisive in preventing failures dovetails with Uptime Institute’s advocacy of operational excellence as set forth in the Tier Standard: Operational Sustainability. This was the data center industry¹s first standardization, developed by and for data centers, to address the management shortfalls that could unwind the most advanced, complex, and intelligent of solutions. Uptime Institute was compelled by its findings that the vast majority of data center incidents could be attributed to operations, despite advancements in technology, monitoring, and automation.

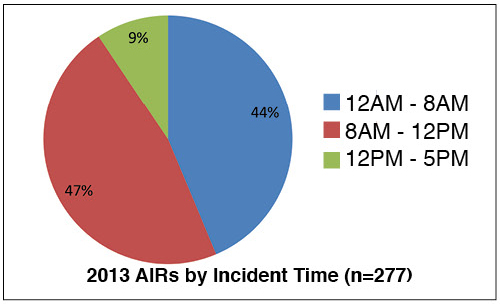
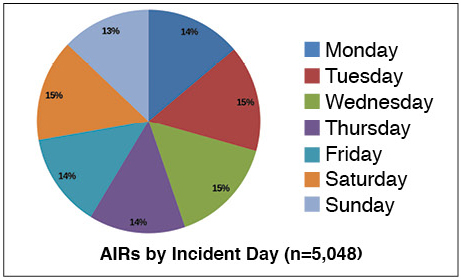
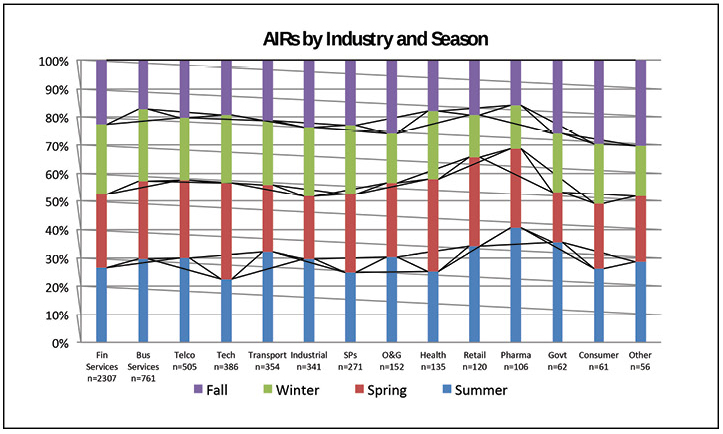
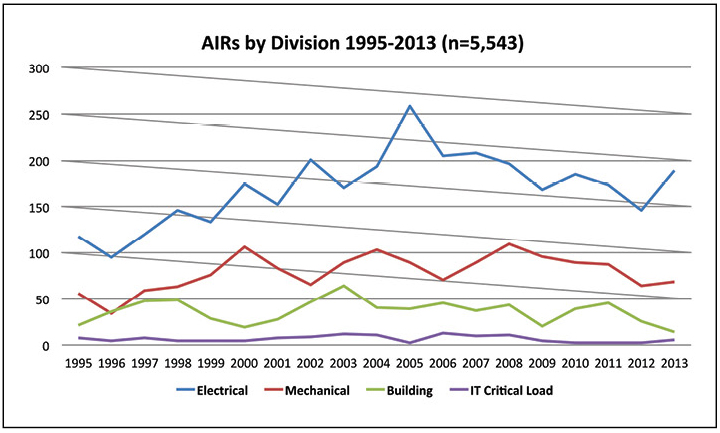
The Operational Sustainability criteria pinpoint the elements that impact long-term data center performance, encompassing site management and operating behaviors, and documentation and mitigation of site-specific risks. The detailed criteria include personnel qualifications and training and policies and procedures that support operating teams in effectively preventing failures and responding appropriately when small failures occur to avoid having them cascade into large critical failures. As Dr. Cook states, “Failure free operations require experience with failure” [Element 18]. We have the opportunity to learn from the experience of other industries, and, more importantly, from the data center industry¹s own experience, as collected and analyzed in Uptime Institute’s Abnormal Incident Reports database. Uptime Institute has captured and catalogued the lessons learned from more than 5,000 errors and incidents over the last 20 years and used that research knowledgebase to help develop an authoritative set of benchmarks. It has ratified these with leading industry experts and gained the consensus of global stakeholders from each sector of the industry. Uptime Institute’s Tier Certifications and Management & Operations (M&O) Stamp of Approval provide the most definitive guidelines for and verification of effective risk mitigation and operations management.

Dr. Cook explains, “More robust system performance is likely to arise in systems where operators can discern the Œedge of the envelope. It also depends on calibrating how their actions move system performance towards or away from the edge of the envelope. [Element 18]” Uptime Institute¹s deep subject matter expertise, long experience, and evidence-based standards can help data center operators identify and stay on the right side of that edge. Organizations like CenturyLink are recognizing the value of applying a consistent set of standards to ensure operational excellence and minimize the risk of failure in the complex systems represented by their data center portfolio (See the sidebar CenturyLink and the M&O Stamp of Approval).

CONCLUSION
Complex systems fail in complex ways, a reality exacerbated by the business need to operate complex systems on the very edge of failure. The highly dynamic environments of building and operating an airplane, ship, or oil rig share many traits with running a high availability data center. The risk tolerance for a data center is similarly very low, and data centers are susceptible to the heroics and missteps of many disciplines. The coalescing element is management, which makes sure that frontline operators are equipped with the hands, tools, parts, and processes they need, and, the unbiased oversight and certifications to identify risks and drive continuous improvement against the continuous exposure to complex failure.

REFERENCES
ASME (American Society of Mechanical Engineers). 2011. Initiative to Address Complex Systems Failure: Prevention and Mitigation of Consequences. Report prepared by Nexight Group for ASME (June). Silver Spring MD: Nexight Group. http://nexightgroup.com/wp-content/uploads/2013/02/initiative-to-address-complex-systems-failure.pdf

Bassett, Vicki. (1998). “Causes and effects of the rapid sinking of the Titanic,” working paper. Department of Mechanical Engineering, the University of Wisconsin. http://writing.engr.vt.edu/uer/bassett.html#authorinfo.

BBC News. 2015. “Safety worries lead US airline to ban battery shipments.” March 3, 2015. http://www.bbc.com/news/technology-31709198

Brown, Christopher and Matthew Mescal. 2014. View From the Field. Webinar presented by Uptime Institute, May 29, 2014. https://uptimeinstitute.com/research-publications/asset/webinar-recording-view-from-the-field

Cook, Richard I. 1998. “How Complex Systems Fail (Being a Short Treatise on the Nature of Failure; How Failure is Evaluated; How Failure is Attributed to Proximate Cause; and the Resulting New Understanding of Patient Safety).” Chicago, IL: Cognitive Technologies Laboratory, University of Chicago. Copyright 1998, 1999, 2000 by R.I. Cook, MD, for CtL. Revision D (00.04.21), http://web.mit.edu/2.75/resources/rando/How%20Complex%20Systems%20Fail.pdf

Dobson, Ian, Benjamin A. Carreras, Vickie E. Lynch and David E. Newman. 2009. “Complex systems analysis of a series of blackouts: Cascading failure, critical points, and self-organization.” Chaos: An Interdisciplinary Journal of Nonlinear Science 17: 026103 (published by the American Institute of Physics).

Dobson, Ian, Benjamin A. Carreras, Vickie E. Lynch and David E. Newman. 2009. “Complex systems analysis of a series of blackouts: Cascading failure, critical points, and self-organization.” Chaos: An Interdisciplinary Journal of Nonlinear Science 17: 026103 (published by the American Institute of Physics).

Dueñas-Osorio, Leonard and Srivishnu Mohan Vemuru. 2009. Abstract for “Cascading failures in complex infrastructure systems.” Structural Safety 31 (2): 157-167.

Funk, McKenzie. 2014. “The Wreck of the Kulluk.” New York Times Magazine December 30, 2014. http://www.nytimes.com/2015/01/04/magazine/the-wreck-of-the-kulluk.html?_r=0

Gallagher, Sean. 2014. “NTSB blames bad battery design‹and bad management‹in Boeing 787 fires.” Ars Technica, December 2, 2014. http://arstechnica.com/information-technology/2014/12/ntsb-blames-bad-battery-design-and-bad-management-in-boeing-787-fires/

Glass, Robert, Walt Beyeler, Kevin Stamber, Laura Glass, Randall LaViolette, Stephen Contrad, Nancy Brodsky, Theresa Brown, Andy Scholand, and Mark Ehlen. 2005. Simulation and Analysis of Cascading Failure in Critical Infrastructure. Presentation (annotated version) Los Alamos National Laboratory, National Infrastructure Simulation and Analysis Center (Department of Homeland Security), and Sandia National Laboratories, July 2005..New Mexico: Sandia National Laboratories. http://www.sandia.gov/CasosEngineering/docs/Glass_annotatedpresentation.pdf

Kirby, R. Lee. 2012. “Reliability Centered Maintenance: A New Approach.” Mission Critical, June 12, 2012. http://www.missioncriticalmagazine.com/articles/84992-reliability-centered-maintenance–a-new-approach

Klesner, Keith. 2015. “Avoiding Data Center Construction Problems.” The The Uptime Institute Journal. 5: Spring 2014: 6-12. https://journal.uptimeinstitute.com/avoiding-data-center-construction-problems/

Lipsitz, Lewis A. 2012. “Understanding Health Care as a Complex System: The Foundation for Unintended Consequences.” Journal of the American Medical Association 308 (3): 243­244. http://jama.jamanetwork.com/article.aspx?articleid=1217248

Lavelle, Marianne. 2014. “Coast Guard blames Shell risk taking in the wreck of the Kulluk.” National Geographic, April 4, 2014. http://news.nationalgeographic.com/news/energy/2014/04/140404-coast-guard-blames-shell-in-kulluk-rig-accident/

“Exxon Valdez Oil Spill.” New York Times.  On NYTimes.com, last updated August 3, 2010. http://topics.nytimes.com/top/reference/timestopics/subjects/e/exxon_valdez_oil_spill_1989/index.html

NTSB (National Transportation Safety Board). 2014. “Auxiliary Power Unit Battery Fire Japan Airlines Boeing 787-8, JA829J.” Aircraft Incident Report released 11/21/14. Washington, DC: National Transportation Safety Board. http://www.ntsb.gov/Pages/..%5Cinvestigations%5CAccidentReports%5CPages%5CAIR1401.aspx

Palast, Greg. 1999. “Ten Years After But Who Was to Blame?” for Observer/Guardian UK, March 20, 1999. http://www.gregpalast.com/ten-years-after-but-who-was-to-blame/

Pederson, Brian. 2014. “Complex systems and critical missions‹today’s data center.” Lehigh Valley Business, November 14, 2014. http://www.lvb.com/article/20141114/CANUDIGIT/141119895/complex-systems-and-critical-missions–todays-data-center

Plsek, Paul. 2003. Complexity and the Adoption of Innovation in Healthcare. Presentation, Accelerating Quality Improvement in Health Care Strategies to Speed the Diffusion of Evidence-Based Innovations, conference in Washington, DC, January 27-28, 2003. Roswell, GA: Paul E Plsek & Associates, Inc. http://www.nihcm.org/pdf/Plsek.pdf

Reason, J. 2000. “Human Errors Models and Management.” British Medical Journal 320 (7237): 768­770. http://www.ncbi.nlm.nih.gov/pmc/articles/PMC1117770/

Reuters. 2014. “Design flaws led to lithium-ion battery fires in Boeing 787: U.S. NTSB.” December 2, 2014. http://www.reuters.com/article/2014/12/02/us-boeing-787-batteryidUSKCN0JF35G20141202

Wikipedia, s.v. “Cascading Failure,” last modified April 12, 2015. https://en.wikipedia.org/wiki/Cascading_failure

Wikipedia, s.v. “The Sinking of The Titanic,” last modified July 21, 2015. https://en.wikipedia.org/wiki/Sinking_of_the_RMS_Titanic

Wikipedia, s.v. “SOLAS Convention,” last modified June 21, 2015. https://en.wikipedia.org/wiki/SOLAS_Convention


John Maclean, author of numerous books, including Fire on the Mountain (Morrow 1999), analyzing deadly wildland fires, suggests rebranding of high reliability organizations, which is a fundamental concept of firefighting crews, military, and commercial airline industry. He argued for high risk organizations. A high reliability organization may only fail, like a goalkeeper, as performance is so highly anticipated. A high risk organization is tasked with averting or minimizing impact and may gauge success in a non-binary fashion. It is a recurring theme in Mr. Maclean’s forensic analyses of deadly fires that front-line operators, including the perished, carry the blame for the outcome and management shortfalls are far less exposed.


CENTURYLINK AND THE M&O STAMP OF APPROVAL

The IT industry has growing awareness of the importance of management-people-process issues. That’s why Uptime Institute¹s Management & Operations (M&0) Stamp of Approval focuses on assessing and evaluating both operations activities and management as equally critical to ensuring data center reliability and performance. The M&O Stamp can be applied to a single data center facility, or administered across an entire portfolio to ensure consistency.

Recognizing the necessity of making a commitment to excellence at all levels of an organization, CenturyLink is the first service provider to embrace the M&O assesment for all of its data centers. It has contracted Uptime Institute to assess 57 data center facilities across a global portfolio. This decision shows the company is willing to hold itself to a uniform set of high standards and operate with transparency. The company has committed to achieve M&O Stamp of Approval standards and certification across the board, protecting its vital networks and assets from failure and downtime and providing its customers with assurance.


Julian Kudritzki

Julian Kudritzki

Julian Kudritzki joined Uptime Institute in 2004 and currently serves as Chief Operating Officer. He is responsible for the global proliferation of Uptime Institute standards. He has supported the founding of Uptime Institute offices in numerous regions, including Brasil, Russia, and North Asia. He has collaborated on the development of numerous Uptime Institute publications, education programs, and unique initiatives such as Server Roundup and FORCSS. He is based in Seattle, WA.

Anne Corning

Anne Corning

Anne Corning is a technical and business writer with more than 20 years experience in the high tech, healthcare, and engineering fields. She earned her B.A. from the University of Chicago and her M.B.A. from the University of Washington¹s Foster School of Business. She has provided marketing, research, and writing for organizations such as Microsoft, Skanska USA ­ Mission Critical, McKesson, Jetstream Software, Hitachi Consulting, Seattle Children¹s Hospital Center for Clinical Research, Adaptive Energy, Thinking Machines Corporation (now part of Oracle), BlueCross BlueShield of Massachusetts, and the University of Washington Institute for Translational Health Sciences. She has been a part of several successful entrepreneurial ventures and is a Six Sigma Green Belt.

—-

The post Examining and Learning from Complex Systems Failures appeared first on Uptime Institute eJournal.

Failure Doesn’t Keep Business Hours: 24×7 Coverage

$
0
0

A statistical justification for 24×7 coverage
By Richard Van Loo

As a result of performing numerous operational assessments at data centers around the world, Uptime Institute has observed that staffing levels at data centers vary greatly from site to site. This observation is discouraging, but not surprising, because while staffing is an important function for data centers attempting to maintain operational excellence, many factors influence an organization’s decision on appropriate staffing levels.

Factors that can affect overall staffing numbers include the complexity of the data center, the level of IT turnover, the number of support activity hours required, the number of vendors contracted to support operations, and business objectives for availability. Cost is also a concern because each staff member represents a direct cost. Because of these numerous factors, data center staffing levels must be constantly reviewed in an attempt to achieve effective data center support at a reasonable cost.

Uptime Institute is often asked, “What is the proper staffing level for my data center.” Unfortunately, there is no quick answer that works for every data center since proper staffing depends on a number of variables.

The time required to perform maintenance tasks and provide shift coverage support are two basic variables. Staffing for maintenance hours requirements is relatively fixed, but affected by which activities are performed by data center personnel and which are performed by vendors. Shift coverage support is defined as staffing for data center monitoring and rounds and for responding to any incidents or events. Staffing levels to support shift coverage can be provided in a number of different ways. Each method of providing shift coverage has potential impacts on operations depending on how that that coverage is focused.

TRENDS IN SHIFT COVERAGE
The primary purpose of having qualified personnel on site is to mitigate the risk of an outage caused by abnormal incidents or events, either by preventing the incident or containing and isolating the incident or event and keeping it from spreading or impacting other systems. Many data centers still support data shift presence with a team of qualified electricians, mechanics, and other technicians who provide 24 x 7 shift coverage. Remote monitoring technology, designs that incorporate redundancy, campus data center environments, the desire to balance costs, and other practices can lead organizations to deploy personnel differently.

Managing shift presence without having qualified personnel on site at all times can elevate risks due to delayed response to abnormal incidents. Ultimately, the acceptable level of risk must be a company decision.

Other shift presence models include:

• Training security personnel to respond to alarms and execute an escalation procedure

• Monitoring the data center through a local or regional building monitoring system (BMS) and having technicians on call

• Having personnel on site during normal business hours and on call during nights and weekends

• Operating multiple data centers as a campus or portfolio so that a team supports multiple data centers without necessarily being on site at each individual data center at a given time

These and other models have to be individually assessed for effectiveness. To assess the effectiveness of any shift presence model, the data center must determine the potential risks of incidents to the operations of the data center and the impact on the business.

For the last 20 years, Uptime Institute has built the Abnormal Incident Reports (AIRs) database using information reported by Uptime Institute Network members. Uptime Institute analyzes the data annually and reports its findings to Network members. The AIRs database provides interesting insights relating to staffing concerns and effective staffing models.

INCIDENTS OCCUR OUTSIDE BUSINESS HOURS
In 2013, a slight majority of incidents (out of 277 total incidents) occurred during normal business hours. However, 44% of incidents happened between midnight and 8:00 a.m., which underscores the potential need for 24 x 7 coverage (see Figure 1).

Figure 1. Approximately half the AIRs that occurred in 2013 took place occurred between 8 a.m. and 12 p.m., the other half between 12 a.m. and 8 a.m.

Figure 1. Approximately half the AIRs that occurred in 2013 took place occurred between 8 a.m. and 12 p.m., the other half between 12 a.m. and 8 a.m.

Similarly, incidents can happen at any time of the year. As a result, focusing shift presence activities toward a certain time of year over others would not be productive. Incident occurrence is pretty evenly spread out over the year.

Figure 2 details the day of the week when incidents occurred. The chart shows that incidents occur on nearly an equal basis every day of the week, which suggests that shift presence requirement levels should be the same every day of the week. To do otherwise would leave shifts with little or no shift presence to mitigate risks. This is an important finding because some data centers focus their shift presence support Monday through Friday and leave weekends to more remote monitoring (see Figure 2).

Figure 2. Data center staff must be ready every day of the week.

Figure 2. Data center staff must be ready every day of the week.

INCIDENTS BY INDUSTRY
Figure 3 further breaks down the incidents by industry and shows no significant difference in those trends between industries. The chart does show that the financial services industry reported far more incidents than other industries, but that number reflects the makeup of the sample more than anything.

003

Figure 3. Incidents in data centers take place all year round.

INCIDENT BREAKDOWNS

Knowing when incidents occur does little to say what personnel should be on site. Knowing what kinds of incidents occur most often will help shape the composition of the on-site staff, as will knowing how incidents are most often identified. Figure 4 shows that electrical systems experience the most incidents, followed by mechanical systems. By contrast, critical IT load causes relatively few incidents.

Figure 4. More than half the AIRs reported in 2013 involved the electrical system.

Figure 4. More than half the AIRs reported in 2013 involved the electrical system.

As a result, it would seem to make sense that shift presence teams should have sufficient electrical experience to respond to the most common incidents. The shift presence team must also respond to other types of incidents, but cross training electrical staff in mechanical and building systems might provide sufficient coverage. And, on-call personnel might cover the relatively rare IT-related incidents.

The AIRs database also sheds some light on how incidents are discovered. Figure 5 suggests that over half of all incidents discovered in 2013 were from alarms and more than 40% of incidents are discovered by technicians on site, totaling about 95% of incidents. The biggest change over the years covered by the chart is a slow growth of incidents discovered by alarm.

Figure 5. Alarms are now the source for most AIRs; however, availability failures are more likely to be found by technicians.

Figure 5. Alarms are now the source for most AIRs; however, availability failures are more likely to be found by technicians.

Alarms, however, cannot respond to or mitigate incidents. Uptime Institute has witnessed a number of methods for saving a data center from going down and reducing the impact of a data center incident. These methods require having personnel to respond to the incident, building redundancy into critical systems, and strong predictive maintenance programs to forecast potential failures before they occur. Figure 6 breaks down how often each of these methods produced actual saves.

Figure 6. Equipment redundancy was responsible for more saves in 2013 than in previous years.

Figure 6. Equipment redundancy was responsible for more saves in 2013 than in previous years.

The chart also appears to suggest that in recent years, equipment redundancy and predictive maintenance are producing more saves and technicians fewer. There are several possible explanations for this finding, including more robust systems, greater use of predictive maintenance, and budget cuts that reduce staffing or move it off site.

FAILURES
The data show that all the availability failures in 2013 were caused by electrical system incidents. A majority of the failures occurred because maintenance procedures were not followed. This finding underscores the importance of having proper procedures and well trained staff, and ensuring that vendors are familiar with the site and procedures.

Figure 7. Almost half the AIRs reported in 2013 were In Service.

Figure 7. Almost half the AIRs reported in 2013 were In Service.

Figure 7 further explores the causes of incidents in 2013. Roughly half the incidents were described as “In Service,” which is defined as inadequate maintenance, equipment adjustment, operated to failure, or no root cause found. The incidents attributed to preventive maintenance actually refer to preventive maintenance that was performed improperly. Data center staff caused just 2% of incidents, showing that the interface of personnel and equipment is not a main cause of incidents and outages.

SUMMARY
The increasing sophistication of data center infrastructure management (DCIM), building management systems (BMS), and building automation systems (BAS) is increasing the question of whether staffing can be reduced at data centers. The advances in these systems are great and can enhance the operations of your data center; however, as the AIRs data shows, mitigation of incidents often requires on-site personnel. This is why it is still a prescriptive behavior for Tier III and Tier IV Operational Sustainability Certified data centers to have qualified full time equivalent (FTE) personnel on site at all times. The driving purpose is to provide quick response time to mitigate any incidents and events. The data show that there is no pattern as to when incidents occur. Their occurrence is pretty well spread across all hours of the day and all days of the week. Watching as data centers continue to evolve with increased remote access and more redundancy built in, will show if the trends continue in their current path. As with any data center operations program the fundamental objective is risk avoidance. Each data center is unique with its own set of inherent risks. Shift presence is just one factor, but a pretty important one; a decision on how many to staff, for each shift, and with what qualifications, can have major impact on risk avoidance and continued data center availability. Choose wisely.


Rich Van Loo

Rich Van Loo

Rich Van Loo is Vice President, Operations for Uptime Institute. He performs Uptime Institute Professional Services audits and Operational Sustainability Certifications. He also serves as an instructor for the Accredited Tier Specialist course.

Mr. Van Loo’s work in critical facilities includes responsibilities ranging from projects manager of a major facility infrastructure service contract for a data center, space planning for the design/construct for several data center modifications, and facilities IT support. As a contractor for the Department of Defense, Mr. Van Loo provided planning, design, construction, operation, and maintenance of worldwide mission critical data center facilities. Mr. Van Loo’s 27-year career includes 11 years as a facility engineer and 15 years as a data center manager.

The post Failure Doesn’t Keep Business Hours: 24×7 Coverage appeared first on Uptime Institute eJournal.


Tier Certification for Modular and Phased Construction

$
0
0

Special care must be taken on modular and phased construction projects to avoid compromising reliability goals. Shared system coordination could defeat your Tier Certification objective
By Chris Brown

Today, we often see data center owners taking a modular or phased construction approach to reduce the costs of design, construction, and operation and build time. Taking a modular or phased construction approach allows companies to make a smaller initial investment and to delay some capital expenditures by scaling capacity with business growth.

The modular and phased construction approaches bring some challenges, including the need for multiple design drawings for each phase, potential interruption of regular operations and systems during expansion, and the logistics of installation and commissioning alongside a live production environment. Meticulous planning can minimize the risks of downtime or disruption to operations and enable a facility to achieve the same high level of performance and resilience as conventionally built data centers. In fact, with appropriate planning in the design stage and by aligning Tier Certification with the commissioning process for each construction phase, data center owners can simultaneously reap the business and operating benefits of phased construction along with the risk management and reliability validation benefits of Tier Certification Constructed Facility (TCCF).

DEFINING MODULAR AND PHASED CONSTRUCTION
The terms modular construction and phased construction, though sometimes used interchangeably, are distinct. Both terms refer to the emerging practice of building production capacity in increments over time based on expanded need.

Figure 1. Phased construction allows for the addition of IT capacity over but time but relies on infrastructure design to support each additional IT increment.

Figure 1. Phased construction allows for the addition of IT capacity over but time but relies on infrastructure design to support each additional IT increment.

However, though all modular construction is by its nature phased, not all phased construction projects are modular. Uptime Institute classifies phased construction as any project in which critical capacity components are installed over time (see Figure 1). Such projects often include common distribution systems. Modular construction describes projects that add capacity in blocks over time, typically in repeated, sequential units, each with self-contained infrastructure sufficient to support the capacity of the expansion unit rather than accessing shared infrastructure (see Figure 2).

Figure 2. Modular design supports the IT capacity growth over time by allowing for separate and independent expansions of infrastructure.

Figure 2. Modular design supports the IT capacity growth over time by allowing for separate and independent expansions of infrastructure.

For example, a phased construction facility might be built with adequate electrical distribution systems and wiring to support the ultimate intended design capacity, with additional power supply added as needed to support growing IT load. Similarly, cooling piping systems might be constructed for the entire facility at the outset of a project, with additional pumps or chiller units added later, all using a shared distribution system.

Figure 3. Simplified modular electrical system with each phase utilizing independent equipment and distribution systems

Figure 3. Simplified modular electrical system with each phase utilizing independent equipment and distribution systems

For modular facilities, the design may specify an entire electrical system module that encompasses all the engine-generator sets, uninterruptible power supply (UPS) capacities, and associated distribution systems needed to support a given IT load. Then, for each incremental increase in capacity, the design may call for adding another separate and independent electrical system module to support the IT load growth. These two modules would operate independently, without sharing distribution systems (see Figure 3). Taking this same approach, a design may specify a smaller chiller, pump, piping, and an air handler to support a given heat load. Then, as load increases, the design would include the addition of another small chiller, pump, piping, and air handler to support the incremental heat load growth instead of adding onto the existing chilled water or piping system. In both examples, the expansion increments do not share distribution systems and therefore are distinct modules (see Figure 4).

Figure 4. Simplified modular mechanical system with each phase utilizing independent equipment and distribution systems expansions of infrastructure.

Figure 4. Simplified modular mechanical system with each phase utilizing independent equipment and distribution systems expansions of infrastructure.

CERTIFICATION IN A PHASED MODEL­: DESIGN THROUGH CONSTRUCTION
Organizations desiring a Tier Certified data center must first obtain Tier Certification of Design Documents (TCDD). For phased construction projects, the Tier Certification process culminates with TCCF after construction. (For conventional data center projects the Tier Certification process culminates in Tier Certification of Operational Sustainability.) TCCF validates the facility Tier level as it has been built and commissioned. It is not uncommon for multiple infrastructure and/or system elements to be altered during construction, which is why Tier Certification does not end with TCDD; a facility must undergo TCCF to ensure that the facility was built and performs as designed, without any alterations that would compromise its reliability. This applies whether a conventional, phased, or modular construction approach is used.

In a phased construction project, planning for Tier Certification begins in the design stage. To receive TCDD, Uptime Institute will review each phase and all design documents from the initial build through the final construction phase to ensure compliance with Tier Standards. All phases should meet the requirements for the Tier objective.

Certification of each incremental phase of the design depends on meaningful changes to data center capacity, meaningful being the key concept. For example, upgrading a mechanical system may increase cooling capacity, but if it does not increase processing capacity, it is not a meaningful increment. An upgrade to mechanical and/or electrical systems that expands a facility’s overall processing capacity would be considered a meaningful change and necessitate that a facility have its Certification updated.

In some cases, organizations may not yet have fully defined long-term construction phases that would enable Certification of the ultimate facility. In these situations, Uptime Institute will review design documents for only those phases that are fully defined for Tier Certification specific to those phases. Tier Certification (Tier I-IV) is limited to that specific phase alone. Knowing the desired endpoint is important: if Phase 1 and 2 of a facility do not meet Tier criteria, but subsequently Phase 3 does; then, completion of a TCCF review must wait until Phase 3 is finished.

TCCF includes a site visit with live functional demonstrations of all critical systems, which is typically completed immediately following commissioning. For a phased construction project, Tier Certification of the Phase 1 facility can be the same as Tier Certification for conventional (non-phased) projects in virtually all respects. In both cases, there is no live load at the time, allowing infrastructure demonstrations to be performed easily without risking interruption to the production environment.

Figure 5. Simplified phased electrical system with each additional phase adding equipment while sharing distribution components

Figure 5. Simplified phased electrical system with each additional phase adding equipment while sharing distribution components

The process for Tier Certification of later phases can be as easy as it is for Phase 1 or more difficult, depending on the construction approach. Truly modular expansion designs minimize risk during later phases of commissioning and TCCF because they do not rely on shared distribution systems. Because modules consist of independent, discrete systems, installing additional capacity segments over time does not put facility-wide systems at risk. However, when there is shared infrastructure, as in phased (not modular) projects, commissioning and TCCF can be more complex. Installing new capacity components on top of shared distribution paths, e.g., adding or upgrading an engine generator or UPS module, requires that all testing and demonstrations be repeated across the whole system. It’s important to ensure that all of the system settings work together, for example, verifying that all circuit breaker settings remain appropriate for the new capacity load, so that the new production load will not trip the breakers.

Pre-planning for later phases can help ensure a smooth commissioning and Tier Certification process even with shared infrastructure. As long as the design phases support a Tier Certification objective, there is no reason why phased construction projects cannot be Tier Certified.

COMMISSIONING AND TIER CERTIFICATION
TCCF demonstrations align with commissioning; both must be completed at the same stage (following installation, prior to live load). If a data center design allows full commissioning to be completed at each phase of construction, Tier Certification is achievable for both modular and non-modular phased projects. TCCF demonstrations would be done at the same expansion stages designated for the TCDD at the outset of the project.

For a modular installation, commissioning and Tier Certification demonstrations can be conducted as normal using load banks inside a common data hall, with relatively low risk. If not managed properly, load banks can direct hot air at server intakes, which would be the only significant risk. Obviously this risk can be prevented.

For phased installations that share infrastructure, later phases of commissioning and Tier Certification carry increased risk, because load banks are running in common data halls with shared distribution paths and capacity systems that are supporting a concurrent live load. The best way to reduce the risks of later phase commissioning and Tier Certification is to conduct demonstrations as early in the Certification as possible.

Figure 6. Simplified phased mechanical system with each additional phase adding equipment while sharing distribution components

Figure 6. Simplified phased mechanical system with each additional phase adding equipment while sharing distribution components

Shared critical infrastructure distribution systems included in the initial phase of construction can be commissioned and Tier Certified at full (planned) capacity during the initial TCCF review, so these demonstrations can be front loaded and will not need to be repeated at future expansion phases.

The case studies offer examples of how two data centers approached the process of incorporating phased construction practices without sacrificing Tier Certification vital to supporting their business and operating objectives.

CONCLUSION
Modular and phased construction approaches can be less expensive at each phase and require less up-front capital than traditional construction, but installing equipment that is outside of that specified for the TCDD or beyond the capacity of the TCCF demonstrations puts not only the Tier Certification at risk, but the entire operation. Tier Certification remains valid only until there has been a change to the infrastructure. Beyond that, regardless of an organization’s Tier objective, if construction phases are designed and built in a manner that prevents effective commissioning, then there are greater problems than the status of Tier Certification.
A data center that cannot be commissioned at the completion of a phase incurs increased risk of downtime or system error for that phase of operation and all later phases. Successful commissioning and Tier Certification of phased or modular projects requires thinking through the business and operational impacts of the design philosophy and the decisions made regarding facility expansion strategies. Design decisions must be made with an understanding of which factors are and are not consistent with achieving the Tier Certification‹these are essentially the same factors that allow commissioning. In cases where a facility expansion or system upgrade cannot be Tier Certified, Uptime Institute often sees that is usually the result of limitations inherent in the design of the facility or due to business choices that were made long before.

It is incumbent upon organizations to think through not only the business rationale but also the potential operational impacts of various design and construction choices. Organizations can simultaneously protect their data center investment and achieve the Tier Certification level that supports the business and operating mission‹including modular and phased construction plans‹ by properly anticipating the need for commissioning in Phase 2 and beyond.

Planning design and construction activities to allow for commissioning greatly reduces the organization¹s overall risk. TCCF is the formal validation of the reliability of the built facility.


Case Study: Tier III Certification of Constructed Facility: Phased Construction
An organization planned a South African Tier III facility capital infrastructure project in two build phases, with a shared infrastructure (i.e., non-modular, phased construction). The original design drawings specified two chilled-water plants: an air-cooled chiller plant and an absorption chiller plant, although, the absorption chiller plant was not installed initially due to a limited natural gas supply. The chilled-water system piping was installed up front, and connected to the air-cooled chiller plant. Two air-cooled chillers capable of supporting the facility load were then installed.

The organization installed all the data hall air-handling units (AHUs), including two Kyoto Cooling AHUs, on day one. Because the Kyoto AHUs would be very difficult to install once the facility was built, the facility was essentially designed around them. In other words, it was more cost effective to install both AHUs during the initial construction phase, even if their full capacity would not be reached until after Phase 2.

The facility design utilizes a common infrastructure with a single data hall. Phase 1 called for installing 154 kilowatts (kW) of IT capacity; an additional 306 kW of capacity would be added in Phase 2 for a total planned capacity of 460 kW. Phase 1 TCCF demonstrations were conducted first for the 154 kW of IT load that the facility would be supporting initially. In order to minimize the risk to IT assets when Phase 2 TCCF demonstrations are performed, the commissioning team next demonstrated both AHUs at full capacity. They increased the loading on the data hall to a full 460 kW, successfully demonstrating that the AHUs could support that load in accordance with Tier III requirements.

For Tier Certification of Phase 2, the facility will have to demonstrate that the overall chilled water piping system and additional electrical systems would support the full 460-kW capacity, but they will not have to demonstrate the AHUs again. During Phase 1 demonstrations, the chillers and engine generators ran at N capacity (both units operating) to provide ample power and cooling to show that the AHUs could support 460 kW in a Concurrently Maintainable manner. The Phase 2 demonstrations will not require placing extra load on the UPS, but they did test the effects of putting more load into the data hall and possibly raising the temperature for the systems under live load.


Case Study: Tier III Expanded to Tier IV
The design for a U.S.-based cloud data center validated as a Tier III Certified Constructed Facility after the first construction phase calls for a second construction phase and relies on a common infrastructure (i.e., non-modular, phased construction). The ultimate business objective for the facility is Tier IV, and the facility design supports those objectives. The organization was reluctant to make expenditures on the mechanical UPS required to provide Continuous Cooling for the full capacity of the center until it had secured a client that required Tier IV performance, which would then justify the capital investment in increasing cooling capacity.

The organization was only able to achieve this staged Tier expansion because it worked with Uptime Institute consultants to plan both phases and the Tier demonstrations. For Phase 1, the organization installed all systems and infrastructure needed to support a Tier IV operation, except for the mechanical UPS, thus the Tier Certification objective for Phase 1 was to attain Tier III. Phase 1 Tier Certification included all of the required demonstrations normally conducted to validate Tier III, with load banks located in the data hall. Additionally, because all systems except for the mechanical UPS were already installed, Uptime Institute was able to observe all of the demonstrations that would normally be required for Tier IV TCCF, with the exception of Continuous Cooling.

As a result when the facility is ready to proceed with the Phase 2 expansion, the only demonstrations required to qualify for Tier IV TCCF will be Continuous Cooling. The organization will have to locate load banks within the data hall but will not be required to power those load banks from the IT UPS nor simulate faults on the IT UPS system because that capability has already been satisfactorily observed. Thus, the organization can avoid any risk of interruption to the live customer load the facility will have in place during Phase 2.

The Tier III Certification of Constructed Facility demonstrations require Concurrent Maintainability. The data center must be able to provide baseline power and cooling capacity in each and every maintenance configuration required to operate and maintain the site for an indefinite period. The topology and procedures to isolate each and every component for maintenance, repair, or replacement without affecting the baseline power and cooling capacity in the computer rooms should be in place, with a summary load of 750 kW of critical IT load spread across the data hall. All other house and infrastructure loads required to sustain the baseline load must also be supported in parallel with, and without affecting, the baseline computer room load.

Tier Certification requirements are cumulative; Tier IV encompasses Concurrent Maintainability, with the additional requirements of Fault Tolerance and Continuous Cooling. To demonstrate Fault Tolerance, a facility must have the systems and redundancy in place so that a single failure of a capacity system, capacity component, or distribution element will not impact the IT equipment. The organization must demonstrate that the system automatically responds to a failure to prevent further impact to the site operations. Assessing Continuous Cooling capabilities require demonstrations of computer room air conditioning (CRAC) units under various conditions and simulated fault situations.


Chris Brown

Chris Brown

Christopher Brown joined Uptime Institute in 2010 and currently serves as Vice President, Global Standards and is the Global Tier Authority. He manages the technical standards for which Uptime Institute delivers services and ensures the technical delivery staff is properly trained and prepared to deliver the services. Mr. Brown continues to actively participate in the technical services delivery including Tier Certifications, site infrastructure audits, and custom strategic-level consulting engagements.


The post Tier Certification for Modular and Phased Construction appeared first on Uptime Institute eJournal.

IT Sustainability Supports Enterprise-Wide Efforts

$
0
0

Raytheon integrates corporate sustainability to achieve savings and recognition

By Brian J. Moore

With a history of innovation spanning 92 years, Raytheon Company provides state-of-the-art electronics, mission systems integration, and other capabilities in the areas of sensing, effects, command, control, communications, and intelligence systems, as well as a broad range of mission support services in defense, civil government, and cybersecurity markets throughout the world (see Figure 1). Raytheon employs some of the world’s leading rocket scientists and more than 30,000 engineers and technologists, including over 2,000 employees focused on IT.

Figure 1. Among Raytheon’s many national defense oriented product and solutions are sensors, radar, and other data collection systems that can be deployed as part of global analysis and aviation.

Integration of Raytheon sensors, radars, effectors and cyber help pilots achieve air dominance. (Artist's rendering) air_dom_lead_img_lg

Figure 1. Among Raytheon’s many national defense-oriented product and solutions are sensors, radar, and other data collection systems that can be deployed as part of global analysis and aviation.

Not surprisingly, Raytheon depends a great deal on information technology (IT) as an essential enabler of its operations and as an important component of many of its products and services. Raytheon also operates a number of data centers, which support internal operations and the company’s products and services, which make up the bulk of Raytheon’s enterprise operations.

In 2010, Raytheon established an enterprise-wide IT sustainability program that gained the support of senior leadership. The program increased the company’s IT energy efficiency, which generated cost savings, contributed to the company’s sustainability goals, and enhanced the company’s reputation. Raytheon believes that its success demonstrates that IT sustainability makes sense even in companies in which IT is important, but not the central focus. Raytheon, after all, is a product and services company like many enterprises and not a hyper scale Internet company. As a result, the story of how Raytheon came to develop and then execute its IT sustainability strategy should be relevant to companies in a wide range of industries and having a variety of business models (see Figure 2).

Figure 2. Raytheon’s enterprise-wide sustainability program includes IT and its IT Sustainability Program and gives them both visibility at the company’s most senior levels.

Figure 2. Raytheon’s enterprise-wide sustainability program includes IT and its IT Sustainability Program and gives them both visibility at the company’s most senior levels.

Over the last five years the program has reduced IT power by more than 3 megawatts (MW), including 530 kilowatts (kW) in 2015. The program has also generated over US$33 million in annual cost savings, and developed processes to ensure the 100% eco-responsible management of e-waste (see Figure 3). In addition IT has developed strong working relationships related to energy management with Facilities and other functions; their combined efforts are achieving company-level sustainability goals, and IT sustainability has become an important element of the company’s culture.

Figure 3. Each year, IT sustainability efforts build upon successes of previous years. By 2015, Raytheon had identified and achieved almost 3 megawatts of IT savings.

Figure 3. Each year, IT sustainability efforts build upon successes of previous years. By 2015, Raytheon had identified and achieved almost 3 megawatts of IT savings.

THE IT SUSTAINABILITY OFFICE
Raytheon is proud to be among the first companies to recognize the importance of environmental sustainability, with U.S. Environmental Protection Agency (EPA) recognitions dating back to the early 1980s.

As a result, Raytheon’s IT groups across the company employed numerous people who were interested in energy savings. On their own, they began to apply techniques such as virtualization and optimizing data center airflows to save energy. Soon after its founding, Raytheon’s IT Sustainability (initially Green IT) Office, began aggregating the results of the company’s efficiencies. As a result, Raytheon saw the cumulative impact of these individual efforts and supported the Office’s efforts to do even more work.

The IT Sustainability Office coordinates a core team with representatives from the IT organizations of each of the company’s business units and a few members from Facilities. The IT Sustainability Office has a formal reporting relationship with Raytheon’s Sustainability Steering Team and connectivity with peers in other functions. Its first order of business was to develop a strategic approach to IT sustainability. The IT Sustainability Office adopted the classic military model in which developing strategy means defining the initiative’s ends, ways, and means.

Raytheon chartered the IT Sustainability Office to:

• Develop a strategic approach that defines the program’s ends, ways, and means

• Coordinate IT sustainability efforts across the lines of business and regions of the company

• Facilitate knowledge sharing and drive adoption of best practices

• Ensure alignment with senior leadership and establish and maintain connections with sustainability efforts in other functions

• Capture and communicate metrics and other results

COMMUNICATING ACROSS BUSINESS FUNCTIONS
IT energy savings tend to pay for themselves (see Figure 4), but even so, getting a persistent, comprehensive effort to achieve energy savings requires establishing a strong understanding of why energy savings are important and communicating it company wide. A strong why is needed to overcome barriers common to most organizations:

• Everyone is busy and must deal with competing priorities. Front-line data center personnel have no end of problems to resolve or improvements they would like to make, and executives know they can only focus on a limited number of goals.

• Working together across businesses and functions requires getting people out of their day-to-day rhythms and taking time to understand and be understood by others. It also requires giving up some preferred approaches for the sake of a common approach that will have the benefit of scale and integration.

• Perserverence in the face of inevitable set backs requires a deep sense of purpose and a North Star to guide continued efforts.

Event Name

Figure 4. Raytheon believes that sustainability programs tend to pay for themselves, as in this hypothetical in which adjusting floor tiles and fans improved energy efficiency with no capital expenditure.

Figure 4. Raytheon believes that sustainability programs tend to pay for themselves, as in this hypothetical in which adjusting floor tiles and fans improved energy efficiency with no capital expenditure.

The IT Sustainability Office’s first steps were to define the ends of its efforts and to understand how its work could support larger company goals. The Sustainability Office quickly discovered that Raytheon had a very mature energy program with annual goals that its efforts would directly support. The Sustainability Office also learned about the company’s longstanding environmental sustainability program, which the EPA’s Climate Leaders program regularly recognized for its greenhouse gas reductions. The Sustainability Office’s work would support company goals in this area as well. Members of the IT Sustainability Office also learned about the positive connection between sustainability and other company objectives, including growth, employee engagement, increased innovation, and improved employee recruiting and retention.

As the full picture came into focus, the IT Sustainability Office came to understand that IT energy efficiency could have a big effect on the company’s bottom line. Consolidating a server would not only save energy by eliminating its power draw but also by reducing cooling requirements and eliminating lease charges, operational labor charges, and data center space requirements. IT staff realized that their virtualization and consolidation efforts could help Raytheon avoid building a new data center and also that their use of simple airflow optimization techniques had made it possible to avoid investments in new cooling capacity.

Having established the program’s why, the IT Sustainability Office began to define the what. It established three strategic intents:

• Operate IT as sustainably as possible

• Partner with other functions to create sustainability across the company

• Build a culture of sustainability

Of the three, the primary focus has been operating IT more sustainably. In 2010, Raytheon set 15 public sustainability goals to be accomplished by 2015.  Raytheon’s Board of Directors regularly reviewed progress towards these goals. Of these, IT owned two:

1. Generate 1 MW of power savings in data centers

2. Ensure that 100% of all electronic waste is managed eco-responsibly.

IT met both of these goals and far exceeded its 1 MW power savings goal, generating just over 3 MW of power savings during this period.  In addition, IT contributed to achieving several of the other company-wide goals. For example, reductions in IT power helped the company meet its goal of reducing greenhouse gas emissions. But the company’s use of IT systems also helped in less obvious ways, such as supporting efforts to manage the company’s use of substances of concern and conflict minerals in its processes and products.

This level of executive commitment became a great tool for gaining attention across the company. As IT began to achieve success with energy reductions, the IT Sustainability Office also began to establish clear tie-ins with more tactical goals, such as enabling the business to avoid building more data centers by increasing efficiencies and freeing up real estate by consolidating data centers.

The plan to partner with other functions grew from the realization that Facilities could help IT with data center energy use because a rapidly growing set of sensing, database, and analytics technologies presented a great opportunity to increase efficiencies across all of the company’s operations. Building a culture of sustainability in IT and across the company ensured that sustainability gains would increase dramatically as more employees became aware of the goals and contributed to reaching them. The IT Sustainability Office soon realized that being part of the sustainability program would be a significant motivator and source of job satisfaction for many employees.

Raytheon set new public goals for 2020. Instead of having its own energy goals, IT, Facilities, and others will work to reduce energy use by 10% more and greenhouse gas emissions an additional 12%. The company also wants to utilize 5% renewable energy. However, IT will however continue to own two public goals:

1. Deploy advanced energy management at 100% of the enterprise data centers

2. Deploy a next-generation collaboration environment across the company

THE MEANS
To execute projects such as airflow managements or virtualization that support broader objectives, the IT Sustainability Office makes use of commercially available technologies, Raytheon’s primary IT suppliers, and Raytheon’s cultural/structural resources. Most, if not all, these resources exist in most large enterprises.

Server and storage virtualization products provide the largest energy savings from a technology perspective. However, obtaining virtualization savings requires physical servers to host the virtual servers and storage and modern data center capacity to host the physical servers and storage devices. Successes achieved by the IT Sustainability Office encouraged the company leadership to upgrade infrastructure and the internal cloud computing environment necessary to support the energy-saving consolidation efforts.

The IT Sustainability Office also made use of standard data center airflow management tools such as blanking panels and worked with Facilities to deploy wireless airflow and temperature monitoring to eliminate hotspots without investing in more equipment.

In addition to hardware and software, the IT Sustainability Office leveraged the expertise of Raytheon’s IT suppliers. For example, Raytheon’s primary network supplier provided on-site consulting to help safely increase the temperature set points in network gear rooms. In addition, Raytheon is currently leveraging the expertise of its data center service provider to incorporate advanced server energy management analytics into the company’s environments.

Like all companies, Raytheon also has cultural and organizational assets that are specific to it, including:

• Governance structures that include the sustainability governance model and operating structures with IT facilitate coordination across business groups and the central IT function.

• Raytheon’s Global Communications and Advance Media Services organizations provide professional expertise for getting the company’s message out both internally and externally.

• The cultural values embedded in Raytheon’s vision, “One global team creating trusted, innovative solutions to make the world a safer place,” enable the IT Sustainability Office to get enthusiastic support from anywhere in the company when it needs it.

• An internal social media platform has enabled the IT Sustainability Office to create the “Raytheon Sustainability Community” that has nearly 1,000 self-subscribed members who discuss issues ranging from suggestions for site-specific improvements, to company strategy, to the application of solar power in their homes.

• Raytheon Six Sigma is “our disciplined, knowledge-based approach designed to increase productivity, grow the business, enhance customer satisfaction, and build a customer culture that embraces all of these goals.” Because nearly all the company’s employees have achieved one or more levels of qualification in Six Sigma, Raytheon can quickly form teams to address newly identified opportunities to reduce energy-related waste.

Raytheon’s culture of sustainability pays dividends in multiple ways. The engagement of staff outside of the IT infrastructure and operations function directly benefits IT sustainability goals. For example it is now common for non-IT engineers who work on programs supporting external customers to reach back to IT to help ensure that best practices are implemented for data center design or operation. In addition, other employees use the company’s internal social media platform to get help in establishing power settings or other appropriate means to put the computers in an energy savings mode when they notice wasteful energy use.The Facilities staff has also become very conscious of energy use in computer rooms and data closets and now know how to reach out when they notice a facility that seems to be over-cooled or otherwise running inefficiently. Finally employees now take the initiative to ensure that end-of-life electronics and consumables such as toner or batteries are disposed of properly.

There are also benefits beyond IT energy use. For many employees, the chance to engage with the company’s sustainability program and interact with like-minded individuals across the company is a major plus in their job satisfaction and sense of pride in working for the company. Human Resources values this result so much that it highlight’s Raytheon’s sustainability programs and culture in its recruiting efforts.

Running a sustainability program like this, over time also requires close attention to governance. In addition to having a cross-company IT Sustainability Office, Raytheon formally includes sustainability at each of the three levels of the company sustainability governance model (see Figure 5). A council with membership drawn from senior company leadership provides overall direction and maintains the connection; a steering team comprising functional vice-presidents meets quarterly to track progress, set goals, and make occasional course corrections; and the working team level is where the IT Sustainability Office connects with peer functions and company leadership. This enterprise governance model initially grew out of an early partnership between IT and Facilities that had been formed to address data center energy issues.

Figure 5. Raytheon includes sustainability in each of its three levels of governance.

Figure 5. Raytheon includes sustainability in each of its three levels of governance.

Reaching out across the enterprise, the IT Sustainability Office includes representatives from each business unit who meet regularly to share knowledge, capture and report metrics, and work common issues. This structure enabled Raytheon to build a company-wide community of practice, which enabled it to sustain progress over multiple years and across the entire enterprise.

At first, the IT Sustainability Office included key contacts within each line of business who formed a working team that established and reported metrics, identified and shared best practices, and championed the program within their business. Later, facility engineers and more IT staff would be added to the working team, so that it became the basis for a larger community of practice that would meet occasionally to discuss particular topics or engage a broader group in a project. Guest speakers and the company’s internal social media platform are used to maintain the vitality of this team.

As a result of this evolution, the IT Sustainability Office eventually established partnership relationships with Facilities; Environment, Health and Safety; Supply Chain; Human Resources; and Communications at both the corporate and business levels. These partnerships enabled Raytheon to build energy and virtualization reviews into its formal software development methodology. This makes the software more likely to run in an energy-efficient manner and also easier for internal and external customers to use the software in a virtualized environment.

THE WAYS
The fundamental ways of reducing IT energy use are well known:

• Virtualizing servers and storage allows individual systems to support multiple applications or images, making greater use of the full capabilities of the IT equipment and executing more workloads in less space with less energy

• Identifying and decommissioning servers that are not performing useful work has immediate benefits that become significant when aggregated

• Optimizing airflows, temperature set points, and other aspects of data center facility operations often have very quick paybacks

• Data center consolidation, moving from more, older, less-efficient facilities to fewer, higher efficiency data centers typically reduces energy use and operating costs while also increasing reliability and business resilience

After establishing the ends and the ways, the next step was getting started. Raytheon’s IT Sustainability Office found that establishing goals that aligned with those of leadership was a way to establish credibility at all levels across the company, which was critical to developing initial momentum. Setting targets, however, was not enough to maintain this credibility. The IT Sustainability Office found it necessary to persistently apply best practices at scale across multiple sectors of the company. As a result, IT Sustainability Office devised means to measure, track, and report progress against the goals. The metrics had to be meaningful and realistic, but also practical.

In some cases, measuring energy savings is a straightforward task. When facility engineers are engaged in enhancing the power and cooling efficiency of a single data center, their analyses typically include a fairly precise estimate of expected power savings. In most cases the scale of the work will justify installing meters to gather the needed data. It is also possible to do a precise engineering analysis of the energy savings that come from rehosting a major enterprise resource planning (ERP) environment or a large storage array.

On the other hand, it is much harder to get a precise measurement for each physical server that is eliminated or virtualized at enterprise scale. Though it is generally easy to get power usage for any one server, it is usually not cost effective to measure and capture this information for hundreds or thousands of servers having varying configurations and diverse workloads, especially when the servers operate in data centers of varying configurations and efficiencies.

The IT Sustainability Office instead developed a standard energy savings factor that could be used to provide a valid estimate of power savings when applied to the number of servers taken out of operation. To establish the factor, the IT Sustainability Office did a one-time study of the most common servers in the company’s Facilities and developed a conservative consensus on the net energy savings that result from replacing them with a virtual server.

The factor multiplies an average net plug savings of 300 watts (W) by a Power Usage Effectiveness (PUE) of 2.0, which was both an industry average at that time and a decent estimate of the average across Raytheon’s portfolio of data centers. Though in many cases actual plug power savings exceed 300 W, having a conservative number that could be easily applied allowed for effective metric collection and for communicating the value being achieved. The team also developed a similar factor for cost savings, which took into account hardware lease expense and annual operating costs. These factors, while not precise, were conservative and sufficient to report tens of millions of dollars in cost savings to senior management, and were used thoughout the five-year long pursuit of the company’s 2015 sustainability goal. To reflect current technology and environmental factors, these energy and cost savings factors are being updated in conjunction with setting new goals.

EXTERNAL RECOGNITION
The IT Sustainability Office also saw that external recognition helps build and maintain momentum for the sustainability program. For example, in 2015 Raytheon won a Brill Award for Energy Efficiency from Uptime Institute. In previous years, Raytheon received awards from Computerworld, InfoWorld, Homeland Security Today, and e-stewards. In addition, Raytheon’s CIO appeared on a CNBC People and Planet feature and was recognized by Forrester and ICEX for creating an industry benchmark.

Internal stakeholders, including senior leadership, noted this recognition. The awards increased their awareness of the program and how it was reducing costs, supporting company sustainability goals, and contributing to building the company’s brand. When Raytheon’s CEO mentioned the program and the two awards it won that year at a recent annual shareholders meeting, the program instantly gained credibility.

In addition to IT-specific awards, the IT Sustainability Office’s efforts to partner led it to support company-level efforts to gain recognition for the company’s other sustainability efforts, including providing content each year for Raytheon’s Corporate Responsibility Report and for its application for the EPA Climate Partnership Award. This partnership strategy leads the team to work closely with other functions on internal communications and training efforts.

For instance, the IT Sustainability Office developed one of the six modules in the company’s Sustainability Star program, which recognizes employee efforts and familiarizes them with company sustainability initiatives. The team also regularly provides content for intranet-based news stories, supports campaigns related to Earth Day and Raytheon’s Energy Month, and hosts the Raytheon Sustainabilty Community.


Brian J. Moore

Brian J. Moore

Brian J. Moore is senior principal information systems technologist in the Raytheon Company’s Information Technology (IT) organization in Global Business Services. The Raytheon Company, with 2015 sales of $23 billion and 61,000 employees worldwide, is a technology and innovation leader specializing in defense, security, and civil markets throughout the world. Raytheon is headquartered in Waltham, MA. The Raytheon IT Sustainability Office, which Moore leads, focuses on making IT operations as sustainable as possible, partnering with other functions to leverage IT to make their business processes more sustainable, and creating a culture of sustainability. Since he initiated this program in 2008, it has won six industry awards, including, most recently, the 2015 Brill Award for IT Energy Efficiency from Uptime Institute. Moore was also instrumental in creating Raytheon’s sustainability governance model and in setting the company’s public sustainability goals.

The post IT Sustainability Supports Enterprise-Wide Efforts appeared first on Uptime Institute eJournal.

Bank of Canada Achieves Operational Excellence

$
0
0

The team approach helped the Bank earn Uptime Institute’s M&O Stamp of Approval

By Matt Stansberry

The Bank of Canada is the nation’s central bank. The Bank acts as the fiscal agent of the Canadian government, managing its public debt programs and foreign exchange reserves and setting its monetary policy. It also designs, issues, and distributes Canada’s bank notes. The Bank plays a critical role in supporting the Canadian government and Canada’s financial system. The organization manages a relatively small footprint of high-criticality data centers.

Over the last several years, the Bank has worked with Uptime Institute to significantly upgrade its data center operations framework, and it has also implemented a cross-disciplinary management team that includes stakeholders from IT, Facilities Management, and Security.  The Bank adopted Uptime Institute’s Integrated Critical Environment (ICE) team concept to enhance the effectiveness of the collaboration and shared accountability framework between the three disciplines.

These efforts paid off when the Bank of Canada received a 93% score on the Uptime Institute’s M&O Assessment, which surpassed the 80% pass requirement and the 83% median score achieved by approximately 70 other accredited organizations worldwide. These scores helped the Bank achieved the M&O Stamp of Approval in October 2015.

ICE Program Project Manager Megan Murphy and ICE Program Chairperson David Schroeter explain the challenges and benefits of implementing a multidisciplinary team approach and earning the M&O Stamp of Approval from Uptime Institute.

Uptime Institute: Uptime Institute has been advocating that companies develop multidisciplinary teams for about a decade. Some leading organizations have deployed this kind of management framework, while many more still struggle with interdisciplinary communication gaps and misaligned incentives. Multidisciplinary teams are a highly effective management structure for continuously improving performance and efficiency, while increasing organizational transparency and collaboration. How has your organization deployed this team structure?

Megan Murphy: The Bank likes to shape things in its own way. Certain disciplines are near and dear to our hearts, like security. So our multidisciplinary approach integrates not just IT and Facilities but also Security and our Continuity of Operations Program.

The integrated team looks after the availability and reliability of the Bank’s critical infrastructure supporting the data center.  The team is the glue that binds the different departments together, with a common objective, same language and terminologies, and unified processes. It ultimately allows us to be more resilient and nimble.

The integrated team is virtual, in that each representative reports to a home position on a day-to-day basis.  The virtual team meets regularly, and representatives have the authority to make decisions on behalf of their individual stakeholder groups.

The team functions like a committee. However, where the term “committee” may sound passive; the Bank’s team functions more like a “super committee with teeth.”

David Schroeter: We come together as a committee to review and discuss changes, incidents, schedules as well as coordinate work flows. It requires a lot of effort from the individuals in these departments because of the rigor of the collaborative process, but it has paid off.

As an example, recently there was a facilities infrastructure issue. As a result of the multidisciplinary approach framework, we had the right people in the room to identify the immediate risks associated with this issue and identified that it had a significant impact on other critical infrastructure. We shifted our focus from a simple facilities repair to consider how that change might affect our overall business continuity and security posture.

This information was then quickly escalated to the Bank’s Continuity of Operations office, which activated the corporate incident management process.

It sounds like the collaboration is paying significant benefits.  Why did your organization take this on?

Schroeter: Like other large corporations, our IT and Facilities teams worked within their own organizations, with their own unique perspectives and lenses. We adopted a multidisciplinary approach to bring the stakeholders together and to understand how the things they do every day will inherently impact the other groups. We realized that by not managing our infrastructure using a collaborative team approach, we were incurring needless risk to our operations.

Murphy: This concept is new to the organization, but it reflects a key tenet of the Bank’s overall vision—bringing cross-functional groups together to solve complex issues. That’s really what our team approach does.

Uptime Institute: How did you get started?

Schroeter: We used an iterative approach to develop the program through a working group and interim committee, looking at interdependencies and overlaps between our departments procedures.  Gaps in our processes were revisited and addressed as required.

Murphy: We weren’t trying to reinvent things that already existed in the Bank but rather to leverage the best processes, practices, and wisdom from each department. For example, the IT department has a mature change management process in place. We took their change management template and applied it across the entire environment. Similarly we adopted Security’s comprehensive policy suite for governing and managing access control. We integrated these policies into the process framework.

Schroeter: In addition, we expanded the traditional facilities management framework to include processes to mitigate potential cyber security threats.

The multidisciplinary team allows us to continually improve, be proactive, and respond to a constantly changing environment and technology landscape.

Uptime Institute: Why did you pursue the M&O Stamp of Approval?

Murphy: It gave us a goal, a place to shoot for. Also, the M&O Stamp of Approval needs to be renewed every two years, which means we are going to be evaluated on a regular basis. So we have to stay current and continue to build on this established framework.

Schroeter: We needed a structured approach to managing the critical environment. This is not to say that our teams weren’t professional or didn’t have the competencies to do the work. But when challenged on how or why we did things, they didn’t have a consistent response.

To prepare for the M&O Assessment with Uptime Institute Consultant Richard Van Loo, we took a structured approach that encourages us to constantly look for improvements and to plan for long-term sustainability with a shared goal. It’s not just about keeping the wheels from falling off the bus. It’s about being proactive—making sure the wheels are properly balanced so it rolls efficiently.

Always looking ahead for issues rather than letting them happen.

Did you have any concerns about how you might score on the M&O Assessment?

Schroeter: We were confident that we were going to pass and pass well. We invested a significant amount of time and effort into creating the framework of the program and worked closely with Richard to help ensure that we continued on the right path as we developed documentation. Although we were tracking in the right direction and believed we would pass the assessment, we were not expecting to achieve such a high score. Ultimately our objective was to establish a robust program with a proper governance structure that could sustain operations into the future.

Uptime Institute: What was the most difficult aspect of the process?

Schroeter: Team members spent a lot of time talking to people at the Bank, advocating for the program and explaining why it matters and why it is important. We drank a lot of coffee as we built the support and relationships necessary to ensure the success of the program.

Uptime Institute: What surprised you about the assessment?

Murphy: Despite the initial growing pains that occur when any team comes together, establishing a collective goal and a sense of trust provided the team with stronger focus and clarity. Even with the day-to-day distractions and priorities and different viewpoints, the virtual team became truly integrated. This integration did not happen serendipitously; it took time, persistence, and a lot of hard work.

Uptime Institute: Did having a multidisciplinary team in place make the M&O Assessment process more or less difficult?

Murphy: The multidisciplinary approach made the M&O Assessment easier. In 2014, at the beginning of the process, there were some growing pains as the group was forming and learning how to come together. But by October 2015 when we scored the M&O Assessment, the group had solidified and team members trusted each other, having gone through the inherent ups and downs of the building process. As a result of having a cohesive team, we were confident that our management framework was strong and comprehensive as we had all collaborated and participated in the structure and its associated processes and procedures.

Having an interdisciplinary team provided us with a structured framework in which to have open and transparent discussions necessary to drive and meet the objectives our mandate.

Uptime Institute developed the concept of Integrated Critical Environments teams nearly a decade ago, encouraging organizations to adopt a combined IT-Facilities operating model. This structure became a lynchpin of M&O Stamp of Approval. During the assessment, the participant’s organizational structure is weighted very heavily to address the dangerous misperception that outages are a result of human error (the individual) while they are statistically a result of inadequate training, resource, or protocol (the organization).


Matt Stansberry

Matt Stansberry

Matt Stansberry is Director of Content and Publications for the Uptime Institute and also serves as program director for the Uptime Institute Symposium, an annual event that brings together 1,500 stakeholders in enterprise IT, data center facilities, and corporate real estate to deal with the critical issues surrounding enterprise computing. He was formerly editorial director for Tech Target’s Data Center and Virtualization media group, and was managing editor of Today’s Facility Manager magazine. He has reported on the convergence of IT and facilities for more than a decade.

The post Bank of Canada Achieves Operational Excellence appeared first on Uptime Institute eJournal.

Ignore Data Center Water Consumption at Your Own Peril

$
0
0

Will drought dry up the digital economy? With water scarcity a pressing concern, data center owners are re-examining water consumption for cooling.

By Ryan Orr and Keith Klesner

In the midst of a historic drought in the western U.S., 70% of California experienced “extreme” drought in 2015, according to the U.S. Drought Monitor.

The state’s governor issued an Executive Order requiring a 25% reduction in urban water usage compared to 2013. The Executive Order also authorizes the state’s Water Resources Control Board to implement restrictions on individual users to meet overall water savings objectives. Data centers, in large part, do not appear to have been impacted by new restrictions. However, there is no telling what steps may be deemed necessary as the state continues to push for savings.

The water shortage is putting a premium on the existing resources. In 2015, water costs in the state increased dramatically, with some customers seeing rate increases as high as 28%. California is home to many data centers, and strict limitations on industrial use would dramatically increase the cost of operating a data center in the state.

The problem in California is severe and extends beyond the state’s borders.

Population growth and climate change will create additional global water demand, so the problem of water scarcity is not going away and will not be limited to the California or even the western U.S.; it is a global issue.

On June 24, 2015, The Wall Street Journal published an article focusing on data center water usage, “Data Centers and Hidden Water Use.” With the industry still dealing with environmental scrutiny over carbon emissions, and water scarcity poised to be the next major resource to be publicly examined, IT organizations need to have a better understanding of how data centers consume water, the design choices that can limit water use, and the IT industry’s ability to address this issue.

HOW DATA CENTERS USE WATER
Data centers generally use water to aid heat rejection (i.e., cooling IT equipment). Many data centers use a water-cooled chilled water system, which distributes cool water to computer room cooling units. A fan blows across the chilled water coil, providing cool, conditioned air to IT equipment. That water then flows back to the chiller and is recooled.

Figure 2. Photo of traditional data center cooling tower

Figure 1. Photo of traditional data center cooling tower

Water-cooled chiller systems rely on a large box-like unit called a cooling tower to reject heat collected by this system (see Figure 1). These cooling towers are the main culprits for water consumption in traditional data center designs. Cooling towers cool warm condenser water from the chillers by pulling ambient air in from the sides, which passes over a wet media, causing the water to evaporate. The cooling tower then rejects the heat by blowing hot, wet air out of the top. The cooled condenser water then returns back to the chiller to again accept heat to be rejected. A 1-megawatt (MW) data center will pump 855 gallons of condenser water per minute through a cooling tower, based on a design flow rate of 3 gallons per minute (GPM) per ton.

Figure 2. Cooling towers “consume” or lose water through evaporation, blow down, and drift.

Figure 2. Cooling towers “consume” or lose water through evaporation, blow down, and drift.

Cooling towers “consume” or lose water through evaporation, blow down, and drift (see Figure 2). Evaporation is caused by the heat actually removed from the condenser water loop. Typical design practice allows evaporation to be estimated at 1% of the cooling tower water flow rate, which equates to 8.55 GPM in a fairly typical 1-MW system. Blow down describes the replacement cycle, during which the cooling tower dumps condenser water to eliminate minerals, dust, and other contaminants. Typical design practices allow for blow down to be estimated at 0.5% of the condenser water flow rate, though this could vary widely depending on the water treatment and water quality. In this example, blow down would be about 4.27 GPM. Drift describes the water that is blown away from the cooling tower by wind or from the fan. Typical design practices allow drift to be estimated at 0.005%, though poor wind protection could increase this value. In this example, drift would be practically negligible.

In total, a 1-MW data center using traditional cooling methods would use about 6.75 million gallons of water per year.

CHILLERLESS ALTERNATIVES
Many data centers are adopting new chillerless cooling methods that are more energy efficient and use less water than the chiller and cooling tower combinations. These technologies still reject heat to the atmosphere using cooling towers. However, chillerless cooling methodologies incorporate an economizer that utilizes outdoor air, which means that water is not evaporated all day long or even every day.

Some data centers use direct air cooling, which introduces outside air to the data hall, where it directly cools the IT gear without any conditioning. Christian Belady, Microsoft’s general manager for Data Center Services, once demonstrated the potential of this method by running servers for long periods in a tent. Climate, and more importantly, an organization’s willingness to accept risk of IT equipment failure due to fluctuating temperatures and airborne particulate contamination limited the use of this unusual approach. The majority of organizations that use this method do so in combination with other cooling methods.

Direct evaporative cooling employs outside air that is cooled by a water-saturated medium or via misting. A blower circulates this air to cool the servers (see Figure 3). This approach, while more common than direct outside air cooling, still exposes IT equipment to risk from outside contaminants from external events like forest fires, dust storms, agricultural activity, or construction, which can impair server reliability. These contaminants can be filtered, but many organizations will not tolerate a contamination risk.

Figure 3. Direct evaporative vs. indirect evaporative cooling

Figure 3. Direct evaporative vs. indirect evaporative cooling

Some data centers use what is called indirect evaporative cooling. This process uses two air streams: a closed-loop air supply for IT equipment and an outside air stream that cools the primary air supply. The outside (scavenger) air stream is cooled using direct evaporative cooling. The cooled secondary air stream goes through a heat exchanger, where it cools the primary air stream. A fan circulates the cooled primary air stream to the servers.

WATERLESS ALTERNATIVES
Some existing data center cooling technologies do not evaporate water at all. Air-cooled chilled water systems do not include evaporative cooling towers. These systems are closed loop and do not use makeup water; however, they are much less energy efficient than nearly all the other cooling options, which may offset any water savings of this technology. Air-cooled systems can be fitted with water sprays to provide evaporative cooling to increase capacity and or increase cooling efficiency, but this approach is somewhat rare in data centers.

The direct expansion (DX) computer room air conditioner (CRAC) system includes a dry cooler that rejects heat via an air-to-refrigerant heat exchanger. These types of systems do not evaporate water to reject heat. Select new technologies utilize this equipment with a pumped refrigerant economizer that makes the unit capable of cooling without the use of the compressor. The resulting compressorless system does not evaporate water to cool air either, which improves both water and energy efficiency. Uptime Institute has seen these technologies operate at power usage efficiencies (PUE) of approximately 1.40, even while in full DX cooling mode, and they meet California’s strict Title 24 Building Energy Efficiency Standards.

Table 1. Energy, water, and resource costs and consumption compared for generic cooling technologies.

Table 1. Energy, water, and resource costs and consumption compared for generic cooling technologies.

Table 1 compares a typical water-cooled chiller system to an air-cooled chilled water system in a 1-MW data center, assuming that the water-cooled chiller plant operates at a PUE of 1.6 and the air-cooled chiller plant operates at a PUE of 1.8 with electric rates at $0.16/kilowatt-hour (kWh) and water rates are $6/unit, with one unit being defined as 748 gallons.

The table shows that although air-cooled chillers do not consume any water they can still cost more to operate over the course of a year because water, even though a potentially scarce resource, is still relatively cheap for data center users compared to power. It is crucial to evaluate the potential offsets between energy and cooling during the design process. This analysis does not include considerations for the upstream costs or resource consumption associated with water production and energy production. However, these should also be weighed carefully against a data center’s sustainability goals.

LEADING BY EXAMPLE

Some prominent data centers using alternative cooling methods include:

• Vantage Data Centers’ Quincy, WA, site uses Munters Indirect Evaporative Cooling systems.

• Rackspace’s London data center and Digital Realty’s Profile Park facility in Dublin use roof-mounted indirect outside air technology coupled with evaporative cooling from ExCool.

• A first phase of Facebook’s Prineville, OR, data center uses direct evaporative cooling and humidification. Small nozzles attached to water pipes spray a fine mist across the air pathway, cooling the air and adding humidity. In a second phase, Facebook uses a dampened media.

• Yahoo’s upstate New York data center uses direct outside air cooling when weather conditions allow.

• Metronode, a telecommunications company in Australia, uses direct air cooling (as well as direct evaporative and DX for backup) in its facilities

• Dupont Fabros is utilizing recycled gray water for cooling towers in its Silicon Valley and Ashburn, VA, facilities. The municipal gray water supplies saves on water cost, reduces water treatment for the municipality, and reuses a less precious form of water.

Facebook reports that its Prineville cooling system uses 10% of the water of a traditional chiller and cooling tower system. ExCool claims that it requires roughly 260,000 gallons annually in a 1-MW data center, 3.3% of traditional data center water consumption, and the data centers using pumped refrigerant systems consume even less water—zero. These companies save water by eliminating evaporative technologies or by combining evaporative technologies with outside air economizers, meaning that they do not have to evaporate water 24×7.

DRAWBACKS TO LOW WATER COOLING SYSTEMS
These cooling systems can cost much more than traditional cooling systems. At current rates for water and electricity, return on investment (ROI) on these more expensive systems can take years to achieve. Compass Datacenters recently published a study showing the potential negative ROI for an evaporative cooling system.

These systems also tend take up a lot of space. For many data centers, water-cooled chiller plants make more sense because an owner can pack in a large capacity system in a relatively small footprint without modifying building envelopes.

There are also implications for data center owners who want to achieve Tier Certification. Achieving Concurrently Maintainable Tier III Constructed Facility Certification requires the isolation of each and every component of the cooling system without impact to design day cooling temperature. This means an owner needs to be able to tolerate the shutdown of cooling units, control systems, makeup water tanks and distribution, and heat exchangers. Fault Tolerance (Tier IV) requires the system to sustain operations without impact to the critical environment after any single but consequential event. While Uptime Institute has Certified many data centers that use newer cooling designs, they do add a level of complexity to the process.

Organizations also need to factor temperature considerations into their decision. If a data center is not prepared to run its server inlet air temperature at 22 degrees Celsius (72 degrees Fahrenheit) or higher, there is not much payback on the extra investment due to the fact that the potential for economization is reduced. Also, companies need to improve their computer room management, including optimizing airflow for efficient cooling, and potentially adding containment, which can drive up costs. Additionally, some of these cooling systems just won’t work in hot and humid climates.

As with any newer technology, alternative cooling systems present operations challenges. Organizations will likely need to implement new training to operate and maintain unfamiliar equipment configurations. Companies will need to conduct particularly thorough due diligence on new, proprietary vendors entering the mission critical data center space for the first time.

And last, there is significant apathy about water conservation across the data center industry as a whole. Uptime Institute survey data shows that less than one-third of data center operators track water usage or use the (WUE) metric. Furthermore, Uptime Institute’s 2015 Data Center Industry Survey found (see The Uptime Institute Journal, vol 6, p. 60) that data center operators ranked water conservation as a low priority.

But the volumes of water or power used by data centers make them easy targets for criticism. While there are good reasons to choose traditional water-cooled chilled water systems, especially when dealing with existing buildings, for new data center builds, owners should evaluate alternative cooling designs against overall business requirements, which might include sustainability factors.

Uptime Institute has invested decades of research toward reducing data center resource consumption. The water topic needs to be assessed within a larger context such as the holistic approach to efficient IT described in Uptime Institute’s Efficient IT programs. With this framework, data center operators can learn how to better justify and explain business requirements and demonstrate that they can be responsible stewards of our environment and corporate resources.

Matt Stansberry contributed to this article.


WATER SOURCES

Data centers can use water from almost any source, with the vast majority of those visited by Uptime Institute using municipal water, which typically comes from reservoirs. Other data centers use groundwater, which is precipitation that seeps down through the soil and is stored below ground. Data center operators must drill wells to access this water. However, drought and overuse are depleting groundwater tables worldwide. The United States Geological Survey has published a resource to track groundwater depletion in the U.S.

Other sources of water include rainfall, gray water, and surface water. Very few data centers use these sources for a variety of reasons. Because rainfall can be unpredictable, for instance, it is mostly collected and used as a secondary or supplemental water supply. Similarly only a handful of data centers around the world are sited near lakes, rivers, or the ocean, but those data center operators could pump water from these sources through a heat exchanger. Data centers also sometimes use a body of water for an emergency water source for cooling towers or evaporative cooling systems. Finally, gray water, which is partially treated wastewater, can be utilized as a non-potable water source for irrigation or cooling tower use. These water sources are interdependent and may be short in supply during a sustained regional drought.


Ryan Orr

Ryan Orr

Ryan Orr joined Uptime Institute in 2012 and currently serves as a senior consultant. He performs Design and Constructed Facility Certifications, Operational Sustainability Certifications, and customized Design and Operations Consulting and Workshops. Mr. Orr’s work in critical facilities includes responsibilities ranging from project engineer on major upgrades for legacy enterprise data centers, space planning for the design and construction of multiple new data center builds, and data center M&O support.


Keith Klesner

Keith Klesner

Keith Klesner is Uptime Institute’s Senior Vice President, North America. Mr. Klesner’s career in critical facilities spans 16 years and includes responsibilities ranging from planning, engineering, design, and construction to start-up and ongoing operation of data centers and mission critical facilities. He has a B.S. in Civil Engineering from the University of Colorado-Boulder and a MBA from the University of LaVerne. He maintains status as a professional engineer (PE) in Colorado and is a LEED Accredited Professional.

The post Ignore Data Center Water Consumption at Your Own Peril appeared first on Uptime Institute eJournal.

Identifying Lurking Vulnerabilities in the World’s Best-Run Data Centers

$
0
0

Peer-based critiques drive continuous improvement, identify lurking data center vulnerabilities

By Kevin Heslin

Shared information is one of the distinctive features of the Uptime Institute Network and its activities. Under non-disclosure agreements, Network members not only share information, but they also collaborate on projects of mutual interest. Uptime Institute facilitates the information sharing and helps draw conclusions and identify trends from the raw data and information submitted by members representing industries such as banking and finance, telecommunications, manufacturing, retail, transportation, government, and colocation. In fact, information sharing is required of all members.

As a result of their Network activities, longtime Network members report reduced frequency and duration of unplanned downtime in their data centers. They also say that they’ve experienced enhanced facilities and IT operations because of ideas, proven solutions, and best practices that they’ve gleaned from other members. In that way, the Network is more than the sum of its parts. Obvious examples of exclusive Network benefits include the Abnormal Incident Reports (AIRs) database , real-time Flash Reports, email inquiries, and peer-to-peer interactions at twice-annual Network conferences. No single enterprise or organization would be able to replicate the benefits created by the collective wisdom of the Network membership.

Perhaps the best examples of shared learning are the data center site tours (140 tours through the fall of 2015) held in conjunction with Network conferences. During these in-depth tours of live, technologically advanced data centers, Network members share their experiences, hear about vendor experiences, and gather new ideas—often within the facility in which they were first road tested. Ideas and observations generated during the site tours are collated during detailed follow-up discussions with the site team. Uptime Institute notes that both site hosts and guests express high satisfaction with these tours. Hosts remark that visitors raised interesting and useful observations about their data centers, and participants witness new ideas in action.

Rob Costa, Uptime Institute North America Network Director, has probably attended more Network data center tours than anyone else, first as a senior manager for The Boeing Co., and then as Network Director. In addition, Boeing and Costa hosted two tours of the company’s facilities since joining the Network in 1997. As a result, Costa is very knowledgeable about what happens during site tours and how Network members benefit.

“One of the many reasons Boeing joined the Uptime Institute Network was the opportunity to visit world-class, mission-critical data centers. We learned a lot from the tours and after returning from the conferences, we would meet with our facility partners and review the best practices and areas of improvement that we noted during the tour,” said Costa.

“We also hosted two Network tours at our Boeing data centers. The value of hosting a tour was the honest and thoughtful feedback from our peer Network members. We focused on the areas of improvement noted from the feedback sessions,” he said.

Recently, Costa noted the improvement in the quality of the data centers hosting tours, as Network members have had the opportunity to make improvements based on the lessons learned from participating in the Network. He said, “It is all about continuous improvement and the drive for zero downtime.” In addition, he has noted an increased emphasis on safety and physical security.

Fred Dickerman, Uptime Institute, Senior Vice President, Management Services, who also hosted a tour of DataSpace facilities, said, “In preparing to host a tour you tend to look at your own data center from a different point of view, which helps you to see things which get overlooked in the day to day. Basically you walk around the data center asking yourself, ‘How will others see my data center?’

Prior to the tour, Network members study design and engineering documents for the facility to get an understanding of the site’s topology.

Prior to the tour, Network members study design and engineering documents for the facility to get an understanding of the site’s topology.

“A manager who has had problems at a data center with smoke from nearby industrial sites entering the makeup air intakes will look at the filters on the host’s data center and suggest improvement. Managers from active seismic zones will look at your structure. Managers who have experienced a recent safety incident will look at your safety procedures, etc.” Dickerman’s perspective summarizes why normally risk-averse organizations are happy to have groups of Network members in their data centers.

Though tour participants have generated literally thousands of comments since 1994  when the first tour was held, recent data suggest that more work remains to improve facilities. In 2015, Network staff collated all the areas of improvement suggested by participants in the data center tours since 2012. In doing so, Uptime Institute counted more than 300 unique comments made in 15 loosely defined categories, with airflow management, energy efficiency, labeling, operations, risk management, and safety meriting the most attention. The power/backup power categories also received a lot of comments. Although categories such as testing, raised floor issues, and natural disasters did not receive many comments, some participants had special interest in these areas, which made the results of the tours all the more comprehensive.

Uptime Institute works with tour hosts to address all security requirements. All participants have signed non-disclosure agreements through the Network.

Uptime Institute works with tour hosts to address all security requirements. All participants have signed non-disclosure agreements through the Network.

Dickerman suggested that the comments highlighted the fact that even the best-managed data centers have vulnerabilities. He highlighted comments related to human action (including negligence due to employee incompetence, lack of training, and procedural or management error) as significant. He also pointed out that some facilities are vulnerable because they lack contingency and emergency response plans.

Site tours last 2 hours and review the raised floor, site’s command center, switchgear, UPS systems, batteries, generators, electrical distribution, and cooling systems.

Site tours last 2 hours and review the raised floor, site’s command center, switchgear, UPS systems, batteries, generators, electrical distribution, and cooling systems.

He notes that events become failures when operators respond too slowly, respond incorrectly, or don’t respond at all, whether the cause of the event is human action or natural disaster. “In almost every major technological disaster, subsequent analysis shows that timely, correct response by the responsible operators would have prevented or minimized the failure. The same is true for every serious data center failure I’ve looked at,” Dickerman said.

It should be emphasized that a lot of the recommendations deal with operations and processes, things that can be corrected in any data center. It is always nice to talk about the next data center “I would build,” but the reality is that not many people will have that opportunity. Everyone, however, can improve how they operate the site.

For example, tour participants continue to find vulnerabilities in electrical systems, perhaps because any electrical system problem may appear instantaneously, leaving little or no time to react. In addition, tour participants also continue to focus on safety, training, physical security, change management, and the presence of procedures.

In recent years, energy efficiency has become more of an issue. Related to this is the nagging sense that Operations is not making full use of management systems to provide early warning about potential problems. In addition, most companies are not using an interdisciplinary approach to improving IT efficiency.

Dickerman notes that changes in industry practices and regulations explain why comments tend to cluster in the same categories year after year. Tour hosts are very safety conscious and tend to be very proud of their safety records, but new U.S. Occupational Safety and Health Administration (OSHA) regulations limiting hot work, for example, increase pressure on facility operators to implement redundant systems that allow for the shutdown of electrical systems to enable maintenance to be performed safely. Tour participants can share experiences about how to effectively and efficiently develop appropriate procedures to track every piece of IT gear and ensure that the connectivity of the gear is known and that it is installed and plugged in correctly.

Of course, merely creating a list of comments after a walk-through is not necessarily helpful to tour hosts. Each network tour concludes with discussion where comments are compiled and discussed. Most importantly Uptime Institute staff moderate discussions, as comments are evaluated and rationales for construction and operations decisions explained. These discussions ensure that all ideas are vetted for accuracy, and that the expertise of the full group is tapped before a comment gets recorded.

Finally, Uptime Institute moderators prepare a final report for use by the tour host, so that the most valid ideas can be implemented.

Pitt Turner, Uptime Institute Executive Director Emeritus, notes that attending or hosting tours is not sufficient by itself, “There has to be motivation to improve. And people with a bias toward action do especially well. They have the opportunity to access technical ideas without worrying about cost justifications or gaining buy in. Then, when they get back to work, they can implement the easy and low-cost ideas and begin to do cost justifications on those with budget impacts.”

TESTIMONIALS

One long-time Network member illustrates that site tours are a two-way street of continuous improvement by telling two stories separated by several years and from different perspectives. “In 1999, I learned two vitally important things during a facility tour at Company A. During that tour my team saw that Company A color coded both its electrical feeds and CEVAC (command, echo, validate, acknowledge, control), which is a process that minimizes the chance for errors when executing procedures. We still color code in this way to this day.

Years later the same Network member hosted a data center tour and learned an important lesson during the site tour. “We had power distribution unit (PDU) breakers installed in the critical distribution switchgear,” he said. “We had breaker locks on the breaker handles that are used to open and close the breakers to prevent an accidental trip. I thought we had protected our breakers well, but I hadn’t noticed a very small red button at the bottom of the breaker that read ‘push to trip’ under it. A Network member brought it to my attention during a tour. I was shocked when I saw it. We now have removable plastic covers over those buttons.”


Kevin Heslin

Kevin Heslin

Kevin Heslin is Chief Editor and Director of Ancillary Projects at Uptime Institute. In these roles, he supports Uptime Institute communications and education efforts. Previously, he served as an editor at BNP Media, where he founded Mission Critical, a commercial publication dedicated to data center and backup power professionals. He also served as editor at New York Construction News and CEE and was the editor of LD+A and JIES at the IESNA. In addition, Heslin served as communications manager at the Lighting Research Center of Rensselaer Polytechnic Institute. He earned the B.A. in Journalism from Fordham University in 1981 and a B.S. in Technical Communications from Rensselaer Polytechnic Institute in 2000.


1


2

The post Identifying Lurking Vulnerabilities in the World’s Best-Run Data Centers appeared first on Uptime Institute eJournal.

Viewing all 238 articles
Browse latest View live